. 2013 Apr 8;8(4):e60028.
doi: 10.1371/journal.pone.0060028. Print 2013.

Willin, an upstream component of the hippo signaling pathway, orchestrates mammalian peripheral nerve fibroblasts

Affiliations

Willin, an upstream component of the hippo signaling pathway, orchestrates mammalian peripheral nerve fibroblasts

Susana Moleirinho et al. PLoS One. .

Abstract

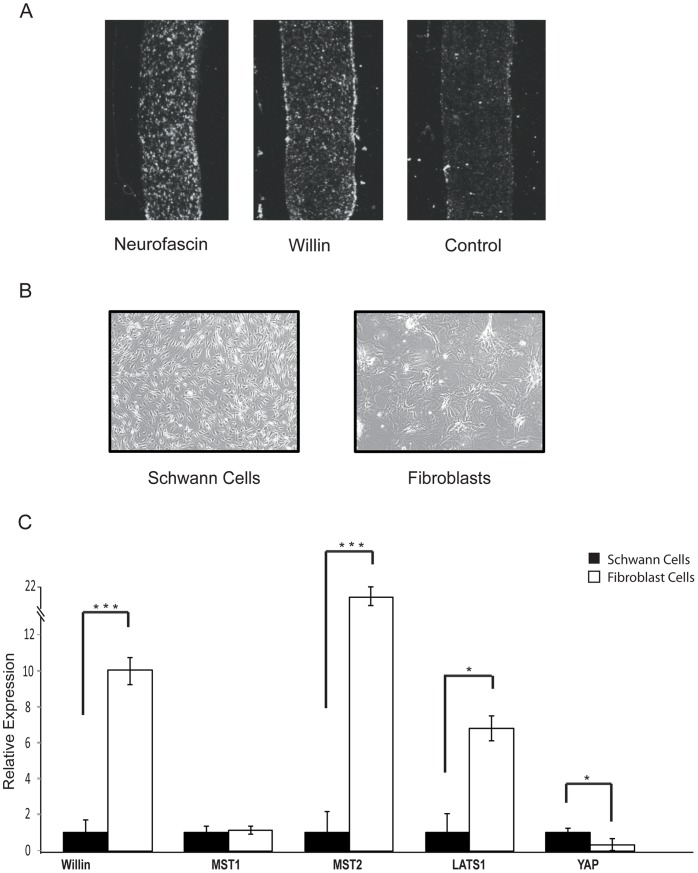
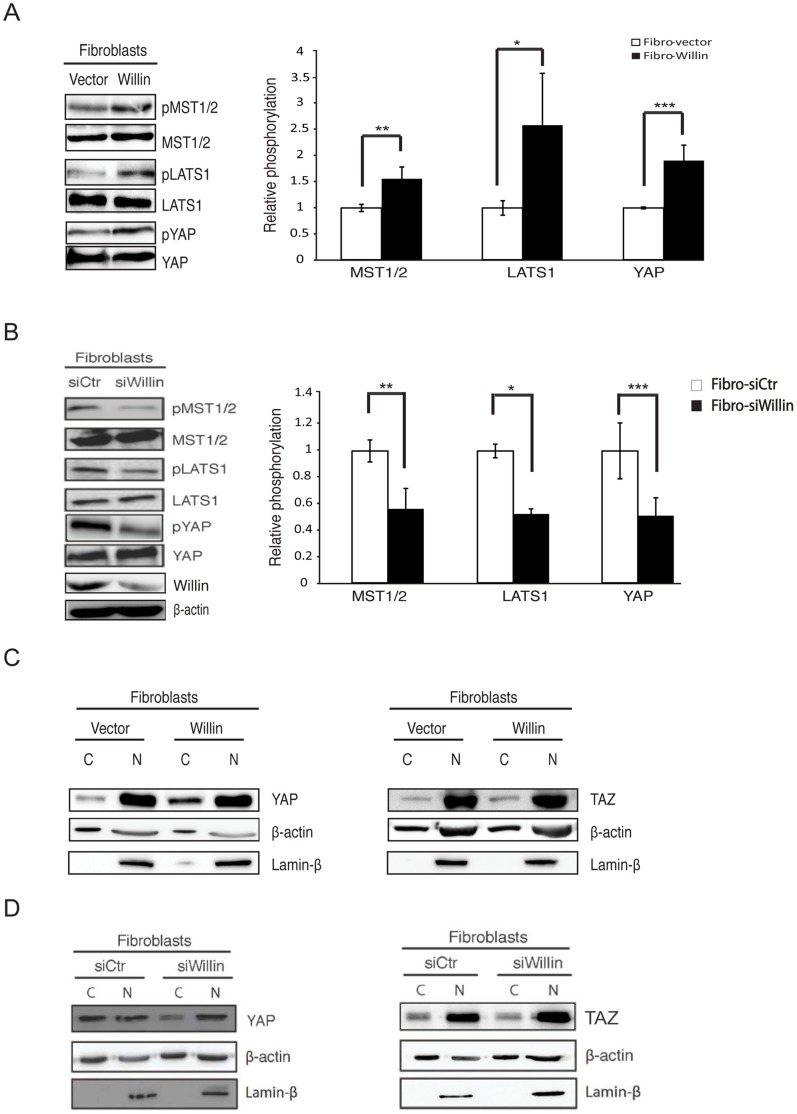
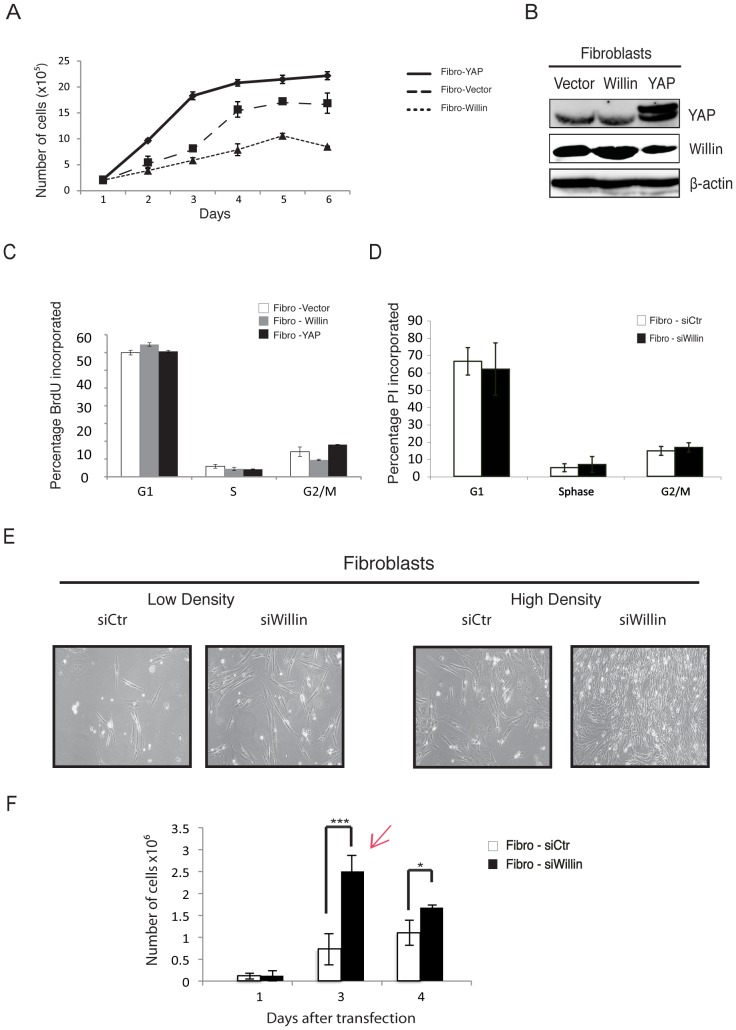
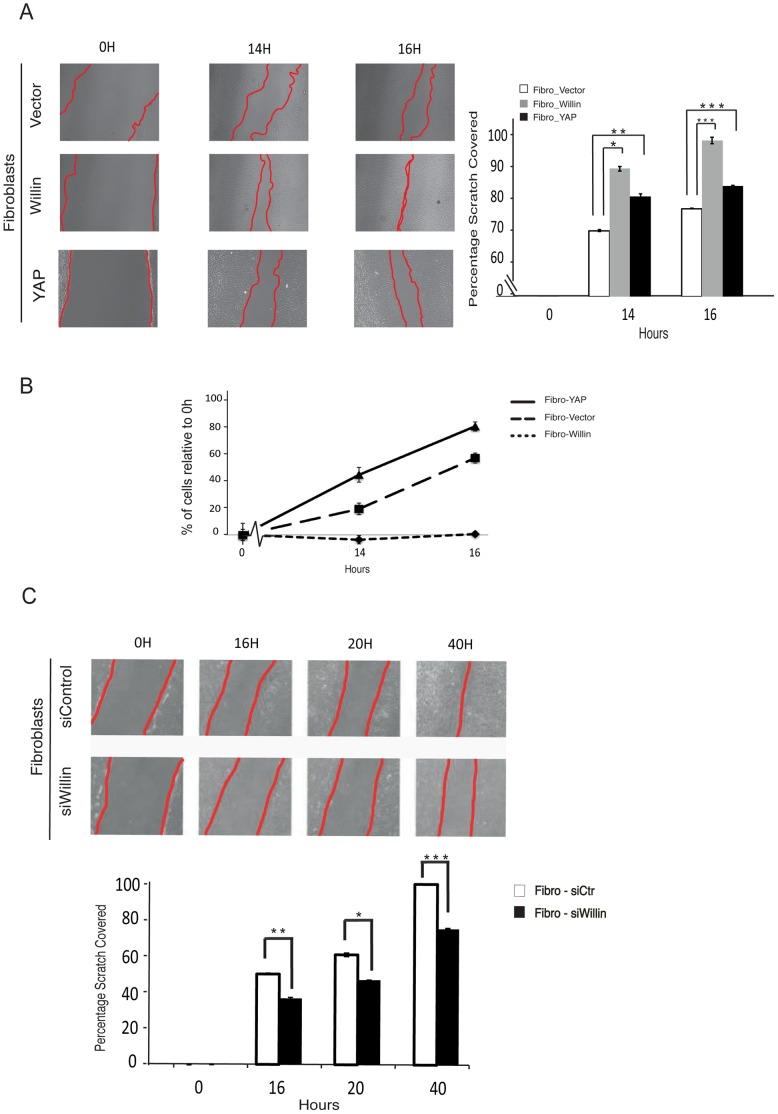
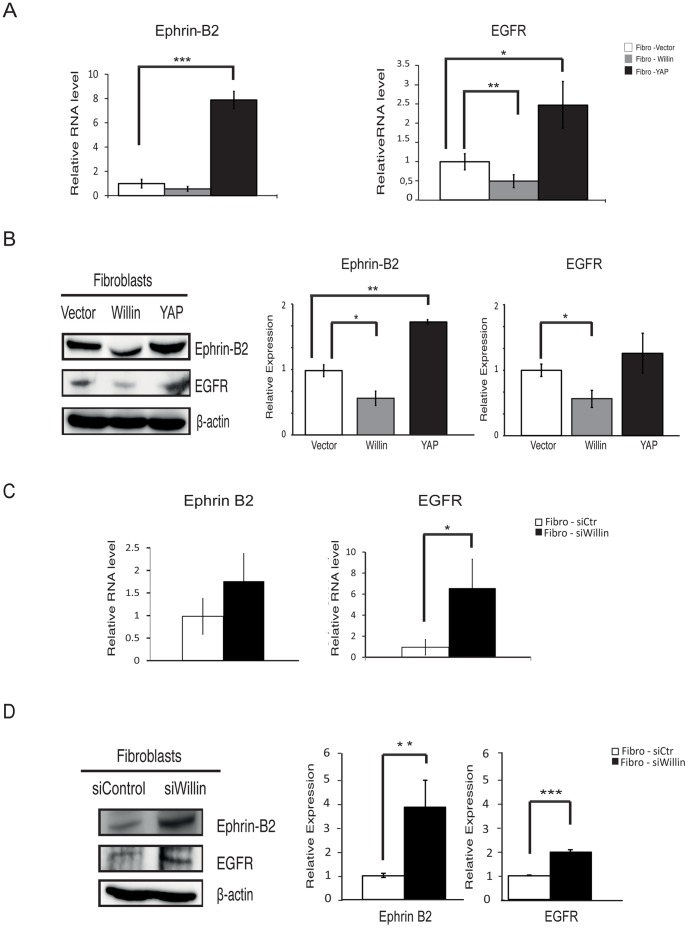
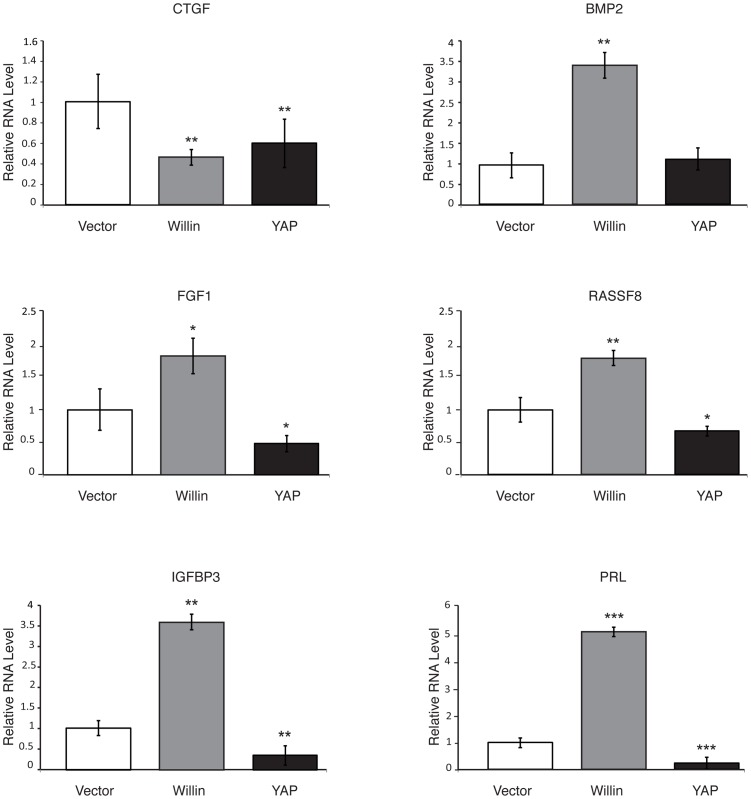
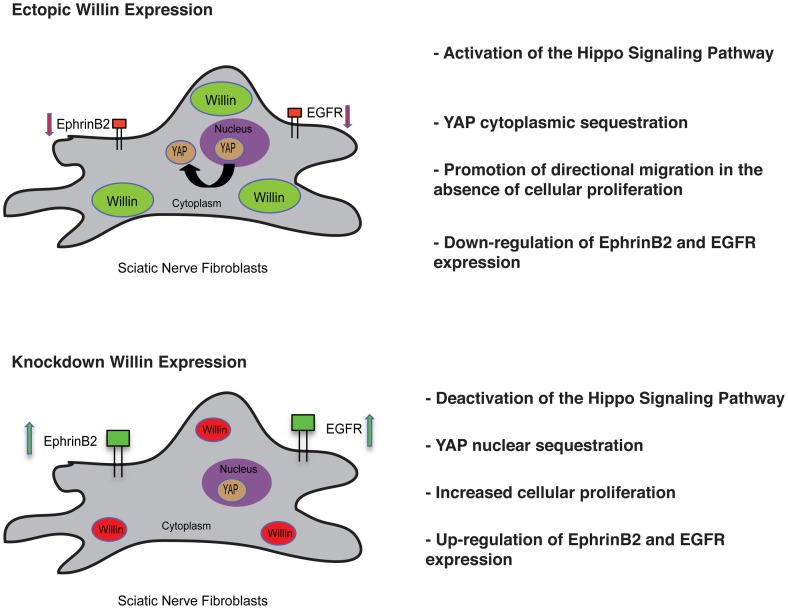
Willin/FRMD6 was first identified in the rat sciatic nerve, which is composed of neurons, Schwann cells, and fibroblasts. Willin is an upstream component of the Hippo signaling pathway, which results in the inactivation of the transcriptional co-activator YAP through Ser127 phosphorylation. This in turn suppresses the expression of genes involved in cell growth, proliferation and cancer development ensuring the control of organ size, cell contact inhibition and apoptosis. Here we show that in the mammalian sciatic nerve, Willin is predominantly expressed in fibroblasts and that Willin expression activates the Hippo signaling cascade and induces YAP translocation from the nucleus to the cytoplasm. In addition within these cells, although it inhibits cellular proliferation, Willin expression induces a quicker directional migration towards scratch closure and an increased expression of factors linked to nerve regeneration. These results show that Willin modulates sciatic nerve fibroblast activity indicating that Willin may have a potential role in the regeneration of the peripheral nervous system.


Conflict of interest statement

Competing Interests: The authors have declared that no competing interests exist.

Figures

Figure 1
Figure 1. Willin is mainly expressed in primary fibroblasts within the sciatic nerve.
(A) Differential expression of Neurofascin 155 and Willin transcripts in rat PNS. Rat sciatic nerve sections were hybridized with riboprobes specific for NF155 or Willin and viewed by dark-field microscope. NF155 transcripts were dispersed around the sciatic nerve, consistent with Schwann cells location at the endoneurium. A robust expression of Willin mRNA was observed at the perineurium suggesting that Willin is expressed in a different population of cells within the sciatic nerve. (B) Pure Schwann cells and fibroblasts cultures isolated from the sciatic nerve present distinct morphologies. Representative phase-contrast images of cells growing in monolayers cultures further confirmed the successful isolation of pure Schwann cells and fibroblasts populations. (C) The hippo signaling pathway is present in the sciatic nerve. mRNA expression of the Hippo pathway components Willin, MST1/2, LATS1 and YAP was determined by quantitative real-time PCR in fibroblasts cells. mRNA levels were compared with Schwann cells (SC set to 1). Willin, MST2, LATS1 mRNA levels are increased in the fibroblasts whereas YAP mRNA expression decreases in these cells. Means were calculated from Ct values in three independent experiments. β-actin was used to normalize for variances in input cDNA. Error bars represent ±s.e. (n = 3). Schwann cells vs fibroblasts for all the analyzed genes: *p<0.05; **p<0.01; ***p<0.001, Student’s t-test. Schwann cells vs fibroblasts: MST1 (p = 0.75); Student’s t-test.
Figure 2
Figure 2. Willin activates the Hippo signaling pathway in fibroblasts of the sciatic nerve.
Immunoblot analysis of the retroviral infected fibroblasts with either Willin or empty vector shows (A) Willin increases MST1/2, LATS1 and YAP phosphorylation. Relative phosphorylation to total proteins levels (MST1/2, LATS1 or YAP) are shown and background phosphorylation (in Fibro-vector) is set to 1. Error bars represent ±s.e. (n = 3). Fibro-vector vs Fibro-Willin: *p<0.05; **p<0.01; ***p<0.001; Student’s t-test. (B) Willin knockdown induces YAP, LATS1 and MST1/2 dephosphorylation. Primary fibroblasts were transfected with either non-targeting siRNA (siCtr) or siRNA targeting Willin (siWillin) for two consecutive days. Cell lysates for western blotting analysis were prepared 48 h post-transfection. The ratios between relative YAP, LATS1 and MST1/2 phosphorylation levels to total proteins (YAP, LATS1 and MST1/2) are shown and background phosphorylation of Fibro-siCtr was arbitrarily set to 1. Immunoblot analysis of efficient Willin knockdown is also presented. β-actin was used as a loading control. Means were calculated from three independent experiments. Error bars represent ± s.e. (n = 3). Fibro-siCtr vs Fibro-siWillin: *p<0.05; **p<0.01; ***p<0.001; Student’s t-test. (C) Willin expression results in YAP, but not TAZ, translocation from the nucleus to the cytoplasm. Cytoplasmic and nuclear fractions were separated for western blot analysis as indicated. The blots shown are representative of three independent experiments (n = 3). (D) Willin knockdown in primary fibroblasts sequesters YAP, but not TAZ, in the nucleus. YAP and TAZ subcellular location was determined by immunoblotting analysis of cytoplasmic and nuclear fractions. β-actin and Lamin-β were used as loading controls for the cytoplasmic and nuclear fractions, respectively. The blots shown are representative of three independent experiments (n = 3).
Figure 3
Figure 3. Ectopic expression of Willin, but not YAP, suppresses cell proliferation in the sciatic nerve.
Primary fibroblasts were retroviral infected with Willin, YAP or an empty vector. Stable pools were selected and maintained in normal fibroblasts medium. (A) Proliferation curves of fibroblasts stably expressing Willin, YAP or an empty vector, over a 6-day time course, show that Willin suppresses cellular proliferation whereas YAP induces it. (B) Immunoblot analysis of YAP and Willin overexpression in primary fibroblasts. β-actin was used as a loading control. (C) Willin and YAP cell proliferation patterns are cell cycle independent. Willin, YAP and vector-overexpressing fibroblasts were cultured to confluence. Cells at a similar density were pulse-labeled with 10 µM BrdU for 1hour, followed by staining with anti-BrdU and propidium iodide (20 µg/ml for 30 min) for flow cytometry. No statistical significant arrest of cells residing in G0/G1, S or G2/M phases was observed. The mean percentage of cells in the different cell cycle phases was determined. Error bars represent ±s.d. (n = 6). (D) Willin knockdown induces cellular proliferation in a cell-cycle independent manner. Cells at a similar density were fixed in 70% ethanol and stained with propidium iodide (4 µg/ml for 30 min) for FACScan analysis. No statistical significant arrest of cells residing in G0/G1, S or G2/M phases was observed. The mean percentage of cells in the different cell cycle phases was determined. Error bars represent ±s.d. (n = 6). (E) Representative phase-contrast images of fibroblasts growing in monolayer cultures transfected with either non-targeting siRNA (siCtr) or siRNA targeting Willin (siWillin) for two consecutive days. Images were taken at low and high density. At low density, siWillin fibroblasts present a large and flat spindle-shape with multiple oval nucleoli with extended and interconnected cell processes protruding from the body of each cell. At high density, the cells are confluent and arranged in parallel arrays with the interconnected processes organized in a dense and close network. This effect is not observed in Fibro-siCtr cells. (F) Proliferation curve of control fibroblasts (siCtr) or knockdown Willin (siWillin) cells. Cells were transiently transfected with the respective siRNAs and the growth curve monitored over 4 days. 48 h after the second transfection Fibro-siWillin cells show a 3.46 fold increase in cell proliferation when compared with the Fibro-siCtr cells. Red arrow – experimental time point indicating when cells were harvested for downstream analyses. Each data point is the mean of three independent experiments. Error bars represent ±s.d. (n = 3). Fibro-siCtr vs Fibro-siWillin: *p<0.05; ***p<0.001; Student’s t-test.
Figure 4
Figure 4. Willin expression promotes fibroblasts migration.
Primary fibroblasts were retroviral infected with Willin, YAP or an empty vector. Stable pools were selected and maintained in normal fibroblasts medium. (A) Willin overexpression promotes faster cellular migration than YAP. Wound closure ability of fibroblasts stable cells was assessed by a wound-healing assay. Representative phase contrast images show the wounded area (0 h) and cell migration towards the wound after 14 h and 16 h. The percentage of scratch covered was measured by quantifying the total distance the cells moved from the edge of the scratch towards the center of the scratch (shown by red lines), using Image J software, followed by conversion to a percentage of scratch covered. Data is presented as the mean percentage of scratch covered in three independent experiments. Error bars represent ±s.d. (n = 3). (B) Willin promotion of wound closure is caused by directional cell migration and not by increased cell proliferation. The number of total cells in each one of the indicated time points was determined by cell count and the percentage of fibroblasts expressing vector, Willin or YAP relative to 0 h assessed. Means were calculated from three independent experiments. Error bars represent ±s.d. (n = 3). (C) Willin knockdown inhibits fibroblasts migration. Representative phase-contrast images of wound healing assay performed in fibro-siCtr or fibro-siWillin fibroblasts show the wounded area (0 h) and cell migration towards the wound after 16 h, 20 h and 40 h (shown by red lines). Motility was quantified as described. Data is presented as the mean percentage of scratch covered in three independent experiments. Error bars represent ±s.d. (n = 3).
Figure 5
Figure 5. Willin is an upstream regulator of EphrinB2 and EGFR.
(A) Willin expression is antagonistic to YAP EphrinB2 and EGFR transcriptional regulation. mRNA levels of Ephrin B2 and EGFR were probed by quantitative real-time PCR. mRNA levels were compared with the empty vector control fibroblast cells (set to 1). At the transcriptional level, Willin overexpression decreases EGFR and to a less extend EphrinB2 whereas YAP results in an increase in both EphrinB2 and EGFR mRNA levels. Means were calculated from Ct values in six independent experiments. β-actin was used to normalize for variances in input cDNA. Error bars represent ±s.e. (n = 6). Fibro-vector vs fibro-Willin or fibro-YAP for the analysed genes: *p<0.05; **p<0.01; ***p<0.001; Student’s t-test. Fibroblasts-vector vs fibroblasts-Willin: EphrinB2 (p = 0.055); Student’s t-test. (B) Immunoblots analysis of EphrinB2 and EGFR show loss of expression upon ectopic Willin expression and gain of EphrinB2 expression upon YAP overexpression when compared to empty vector control (set to 1). β-actin was used as a loading control. Means were calculated from six independent experiments. Error bars represent ±s.e. (n = 6). Fibro-vector vs fibro-Willin or fibro-YAP: *p<0.05; **p<0.01; Student’s t-test. Fibroblasts-vector vs fibroblasts-YAP: EGFR (p = 0.40); Student’s t-test. (C) EGFR mRNA levels are upregulated upon Willin knockdown but EphrinB2 does not show statistical significant change at the transcriptional level. mRNA levels of Ephrin B2 and EGFR were probed by quantitative real-time PCR and mRNA levels compared with the fibro-siCtr cells (set to 1). Means were calculated from Ct values in six independent experiments. β-actin was used to normalize for variances in input cDNA. Error bars represent ±s.e. (n = 6). Fibro-siCtr vs fibro-siWillin cells: *p<0.05; Student’s t-test. Fibro-siCtr vs Fibro-siWillin cells: EphrinB2 (p = 0.555); Student’s t-test. (D) Immunoblots analysis of EphrinB2 and EGFR show upregulated expression when Willin is knockdown. Relative expression was determined compared to background expression (Fibro-siCtr cells set to 1). β-actin was used as a loading control. Means were calculated from three independent experiments. Error bars represent ±s.e. (n = 3). Fibro-siCtr vs Fibro-siWillin cells: **p<0.01; ***p<0.001; Student’s t-test.
Figure 6
Figure 6. Willin antagonizes some of the genes regulated by YAP in sciatic nerve fibroblasts.
mRNA expression of the YAP target genes CTGF, BMP2, FGF1, RASSF8, IGFBP3 and PRL was probed in fibroblasts expressing Willin or YAP by quantitative real-time PCR. mRNA levels were compared with the empty vector control (set to 1). Willin overexpression increased BMP2, FGF1, RASSF8, IGFBP3 and PRL mRNA levels and, together with YAP, decreased CTGF mRNA expression in these cells. Means were calculated from Ct values in three independent experiments. β-actin was used to normalize for variances in input cDNA. Error bars represent ±s.e. (n = 3). Fibroblasts-vector vs fibroblasts-Willin or fibroblasts-YAP for all the analysed genes: *p<0.05; **p<0.01; ***p<0.001; Student’s t-test. Fibroblasts-vector vs fibroblasts-YAP: BMP2 (p = 0.217); Student’s t-test.
Figure 7
Figure 7. Willin orchestrates sciatic nerve fibroblasts.
Ectopic expression of Willin activates the Hippo signaling pathway and YAP translocation from the nucleus to the cytoplasm. It also promotes wound closure by directional migration without increased cellular proliferation and induces down-regulation of ephrinB2 and EGFR expression. Knockdown of Willin expression further supports the aforementioned findings.

Similar articles

Cited by

References

    1. Edgar BA (2006) From cell structure to transcription: Hippo forges a new path. Cell 124: 267–273. - PubMed
    1. Harvey K, Tapon N (2007) The Salvador-Warts-Hippo pathway - an emerging tumour-suppressor network. Nature reviews Cancer 7: 182–191. - PubMed
    1. Pan D (2010) The hippo signaling pathway in development and cancer. Developmental cell 19: 491–505. - PMC - PubMed
    1. Zhao B, Tumaneng K, Guan KL (2011) The Hippo pathway in organ size control, tissue regeneration and stem cell self-renewal. Nature cell biology 13: 877–883. - PMC - PubMed
    1. Dong J, Feldmann G, Huang J, Wu S, Zhang N, et al. (2007) Elucidation of a universal size-control mechanism in Drosophila and mammals. Cell 130: 1120–1133. - PMC - PubMed

Publication types

MeSH terms