. 2013 Apr 12;8(4):e60093.
doi: 10.1371/journal.pone.0060093. Print 2013.

Reorganization of the connectivity of cortical field DZ in congenitally deaf cat

Affiliations

Reorganization of the connectivity of cortical field DZ in congenitally deaf cat

Pascal Barone et al. PLoS One. .

Abstract

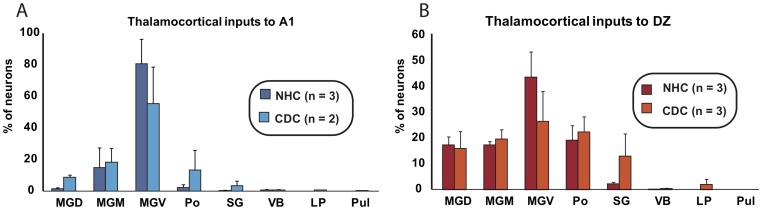
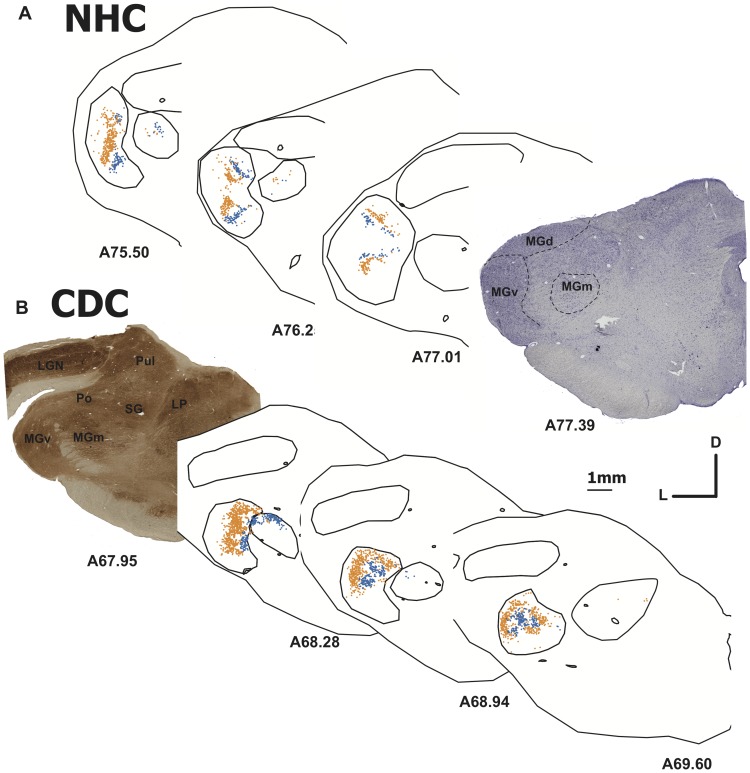
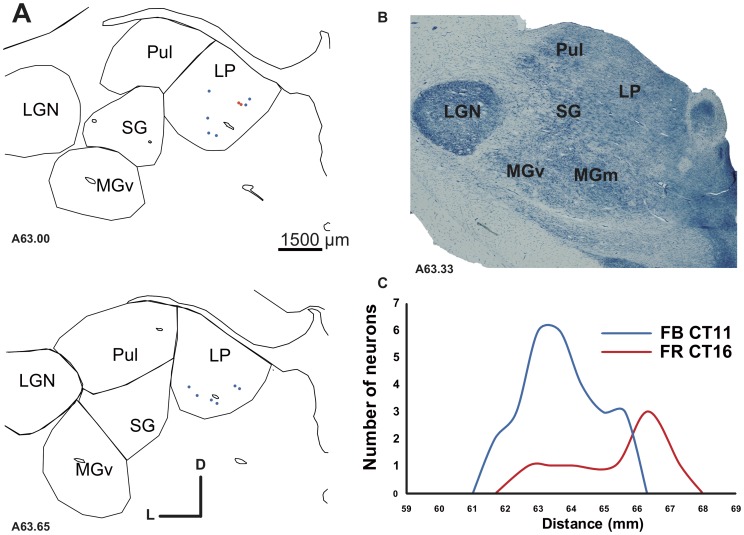
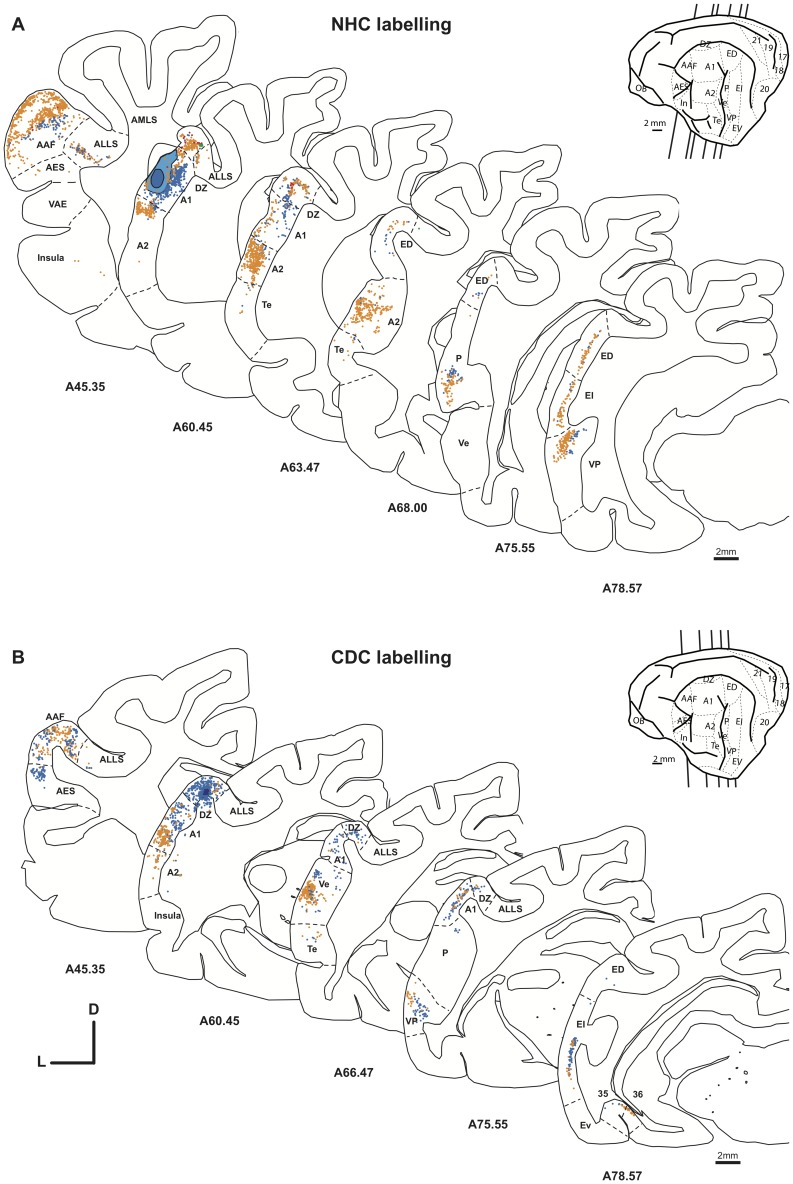
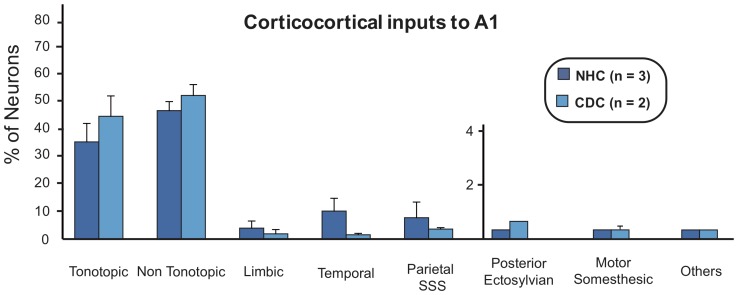
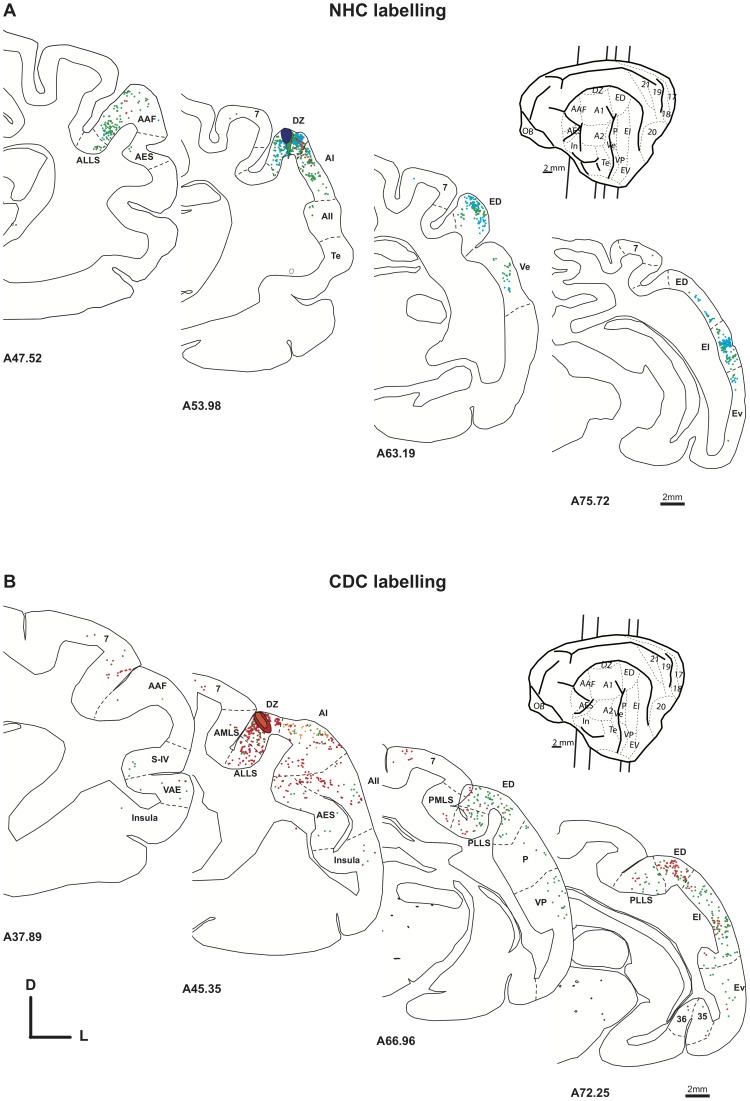
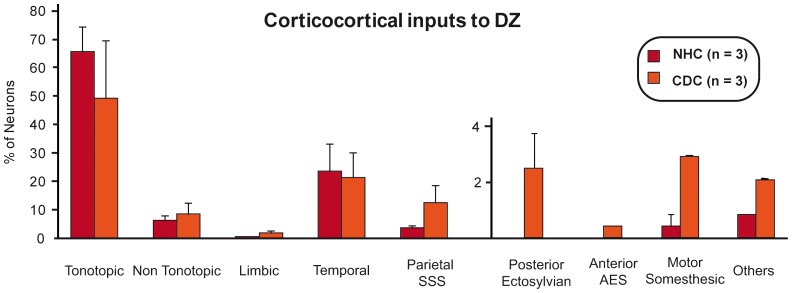
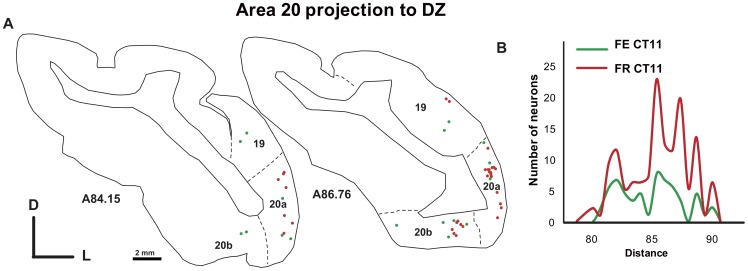
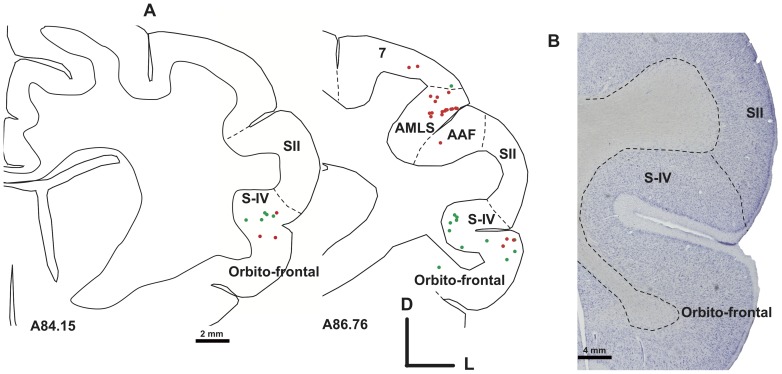
Psychophysics and brain imaging studies in deaf patients have revealed a functional crossmodal reorganization that affects the remaining sensory modalities. Similarly, the congenital deaf cat (CDC) shows supra-normal visual skills that are supported by specific auditory fields (DZ-dorsal zone and P-posterior auditory cortex) but not the primary auditory cortex (A1). To assess the functional reorganization observed in deafness we analyzed the connectivity pattern of the auditory cortex by means of injections of anatomical tracers in DZ and A1 in both congenital deaf and normally hearing cats. A quantitative analysis of the distribution of the projecting neurons revealed the presence of non-auditory inputs to both A1 and DZ of the CDC which were not observed in the hearing cats. Firstly, some visual (areas 19/20) and somatosensory (SIV) areas were projecting toward DZ of the CDC but not in the control. Secondly, A1 of the deaf cat received a weak projection from the visual lateral posterior nuclei (LP). Most of these abnormal projections to A1 and DZ represent only a small fraction of the normal inputs to these areas. In addition, most of the afferents to DZ and A1 appeared normal in terms of areal specificity and strength of projection, with preserved but smeared nucleotopic gradient of A1 in CDCs. In conclusion, while the abnormal projections revealed in the CDC can participate in the crossmodal compensatory mechanisms, the observation of a limited reorganization of the connectivity pattern of the CDC implies that functional reorganization in congenital deafness is further supported also by normal cortico-cortical connectivity.


Conflict of interest statement

Competing Interests: The authors have declared that no competing interests exist.

Figures

Figure 1
Figure 1. Injection sites in Normal hearing cats.
A. Photomicrographs of frontal sections showing the location of three injections sites in A1 (left and middle panels) and DZ (right panel). The sections were processed for cytochrome oxidase (left panel) or Alkaline phosphatase. B. Schematic view of a cat brain areas. Each blob indicates a single injection located in A1 or DZ. In C are represented the 2D reconstructions of the individual dye injections according to their location (normalized distances) with respect to the distance that separate the anterior and posterior ectosylvian sulci (AES and PES). The color lines represent the antero-posterio extent of the pick-up zone of the retrograde dyes, and each of them (3 injections in case CT10 and 3 injections in case CT15) are represented with a different color. The lower graphs DH represent the reconstruction on serial sections of the injection sites in A1 (D–F) and DZ (G–H). In each panel the case number are indicated (se table 1). The number of individual sections are indicated and the low to high numbers underneath the sections, represent the antero-posterior location of individual sections.
Figure 2
Figure 2. Injection sites in congenital deaf cats.
A. Photomicrographs of frontal sections reacted for Alkaline phosphatase showing three injections in A1 (left and middle panels) and DZ (right panel). B. Schematic illustration of cat brain areas. Each injection site in A1 and DZ is indicted by a colored blob. C. 2D reconstructions of the individual 5 dye injections (3 in case CT11 and 2 in case CT16). The lower panels DH represent the reconstruction on serial sections of the injection sites in A1 (D–E) and DZ (F–H). Convention as in figure 1.
Figure 3
Figure 3. Microphotographies showing the location of the injection sites in A1 and DZ.
In A and B is shown the FE injection in DZ of the deaf cat (CT–16) with respect to the A1/DZ border revealed by cytochrome oxidase (A) and SMI-32 (B). In G is shown the location of the FR injection in A1 on a cortical section reacted for SMI-32. The A1/DZ border is assessed by the presence of a rich neuropile staining in the upper layers of DZ as well as the presence of large reactive cells in layer V . In panels C, D and F are illustrated the location of the injection sites in the NHC in A1 (C and F) or DZ (D) after Nissl (F) or CO staining (C–D). E shows a schematic view of a cat brain in which each blob indicates a single injection illustrated in this figure. Scale bars: 2 mm.
Figure 4
Figure 4. Histograms of the means of the distribution (in % of total, ± se) of projecting cells in the thalamic nuclei following an injection in A1 (A) or DZ (B).
Values for normal (NHC) and deaf (CDC) cats are presented separately. No striking differences are observed in the proportions beside an abnormal projection in the deaf cats from the Lateral Posterior nucleus (LP) to A1. The number of injections sites in each group is indicated (n).
Figure 5
Figure 5. Tonotopic organization of the MGB projections to A1 in the normal (A, case CT10) and deaf (B, CT11) cat.
Following a double injection of FB and DY in A1 the distribution of labeled cells are segregated across the MGB in both the normal and deaf cat. In each panel a single dots represents the location of a retrogradely labeled cell following a FB (blue) or a DY (yellow) injection. Nissl (A) and cytochrome oxydase (B) histological staining are shown to identify the location of the thalamic nuclei. Abbreviations: D dorsal, L lateral.
Figure 6
Figure 6. Projection from the Lateral Posterior nucleus (LP) in the deaf cat.
In A is represented the thalamic distribution of labeled cells following two injections in A1 (CT11 FB and DY). B. Alkaline phosphatase staining of an adjacent section. C. Density profiles showing the number of labeled neurons observed on regular serial sections across the LP. The distance axis corresponds to the position of the individual sections on the latero-medial dimension of the brain. The LP projection to A1 is relatively weak, as shown by the paucity of retrogradely number of labeled cells.
Figure 7
Figure 7. Distribution of the projecting neurons to A1 following a FB (blue) or a DY (yellow) injection in the normal (A, case CT10) and in the deaf (B, case CT11 FB and DY) cat.
Only selected sections are shown to illustrate the distribution of labeled cells in the various auditory areas. The insert shows a schematic view of a cat brain areas and the location of the illustrated sections in the antero-posterior axis. Conventions as in figure 5.
Figure 8
Figure 8. Histograms of the means of the distribution of cortical projecting cells following an injection in A1 in the normal (dark) and deaf (light) cat.
The cortical regions that are included in each classes are provided in table 4. For simplicity and because of the low number of labeled cells, projection from the AES and the somato-motor regions are grouped together in the “motor somesthesic” group. The pattern and density of projections are similar when comparing both normal and deaf cats. Conventions as in figure 4.
Figure 9
Figure 9. Distribution of the projecting neurons to DZ in the normal (A, case CT15 FB and FE) and deaf (B, Case CT11 FE and CT11 FR).) cat.
Convention as in figure 7.
Figure 10
Figure 10. Histograms of the means of the distribution of cortical projecting cells following an injection in DZ in the normal (dark) and deaf (light) cat.
Convention as in figure 4 and 8.
Figure 11
Figure 11. Abnormal visual projection from the areas 19/20 to area DZ in the deaf cat (Case CT11 FE and CT11 FR).
In A is shown the distribution of projecting cells in two adjacent sections. The density profiles are presented in B. Convention as in figure 6.
Figure 12
Figure 12. Illustration on two representative sections of the presence of an abnormal projection from the somatosensory area S-IV to DZ in the deaf cat (Case CT11 FE and CT11 FR).
The panel B is a Nissl staining of an adjacent section. Note the high number of labeled cells located in the parietal area 7.

Similar articles

Cited by

References

    1. Rauschecker JP (1995) Compensatory plasticity and sensory substitution in the cerebral cortex. Trends Neurosci 18: 36–43. - PubMed
    1. Collignon O, Champoux F, Voss P, Lepore F (2011) Sensory rehabilitation in the plastic brain. Prog Brain Res 191: 211–231. - PubMed
    1. Röder B, Rosler F (2004) Compensatory plasticity as a consequence of sensory loss. In: Calvert G, Spence C, Stein BE, editors. The handbook of multisensory processes. Cambridge, Mass.: MIT Press. 719–747.
    1. Bavelier D, Dye MW, Hauser PC (2006) Do deaf individuals see better? Trends Cogn Sci 10: 512–518. - PMC - PubMed
    1. Pavani F, Bottari D (2011) Visual abilities in individuals with profound deafness: A critical review. In: Murray MM, Wallace MN, editors. Frontiers in the neural bases of multisensory processes. Boca Raton: CRC Press. in press. - PubMed

Publication types