

Focused examination of the intestinal epithelium reveals transcriptional signatures consistent with disturbances in enterocyte maturation and differentiation during the course of SIV infection
- PMID: 23593167
- PMCID: PMC3621888
- DOI: 10.1371/journal.pone.0060122
Focused examination of the intestinal epithelium reveals transcriptional signatures consistent with disturbances in enterocyte maturation and differentiation during the course of SIV infection
Abstract
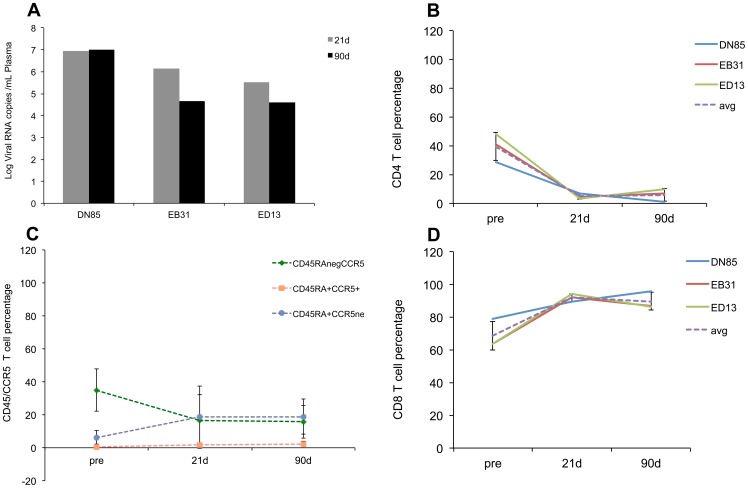
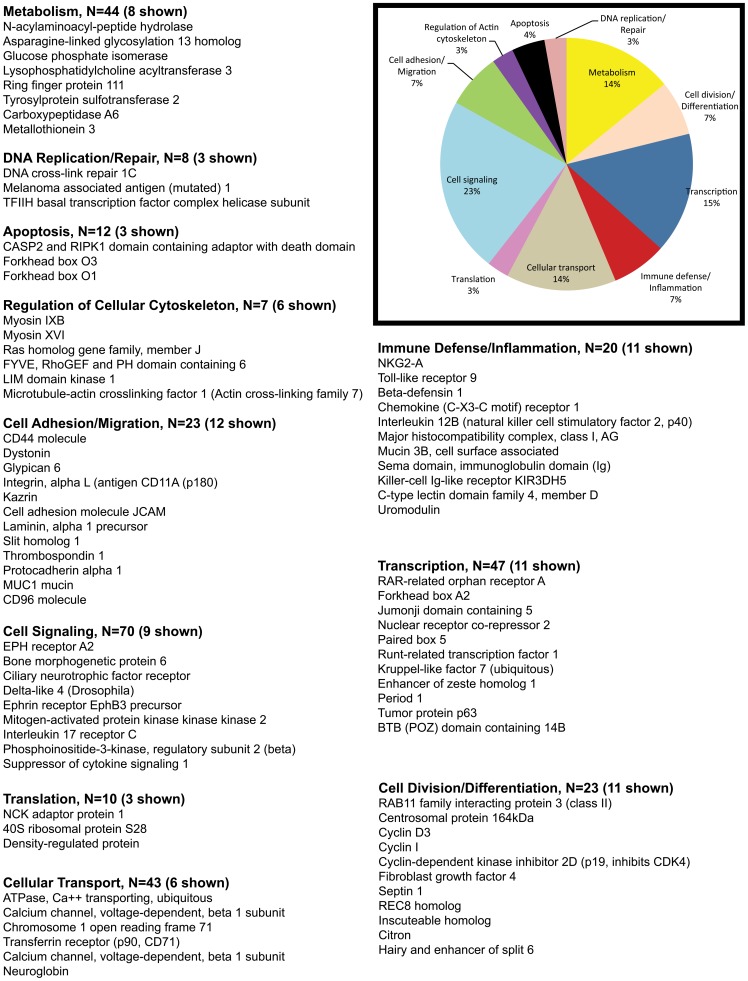
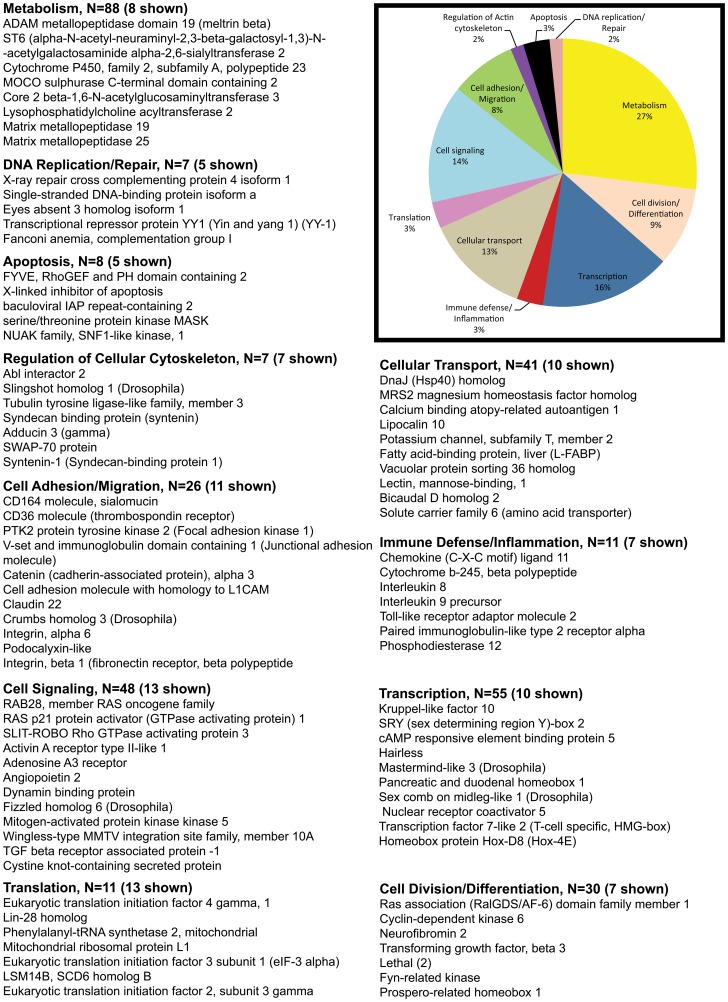
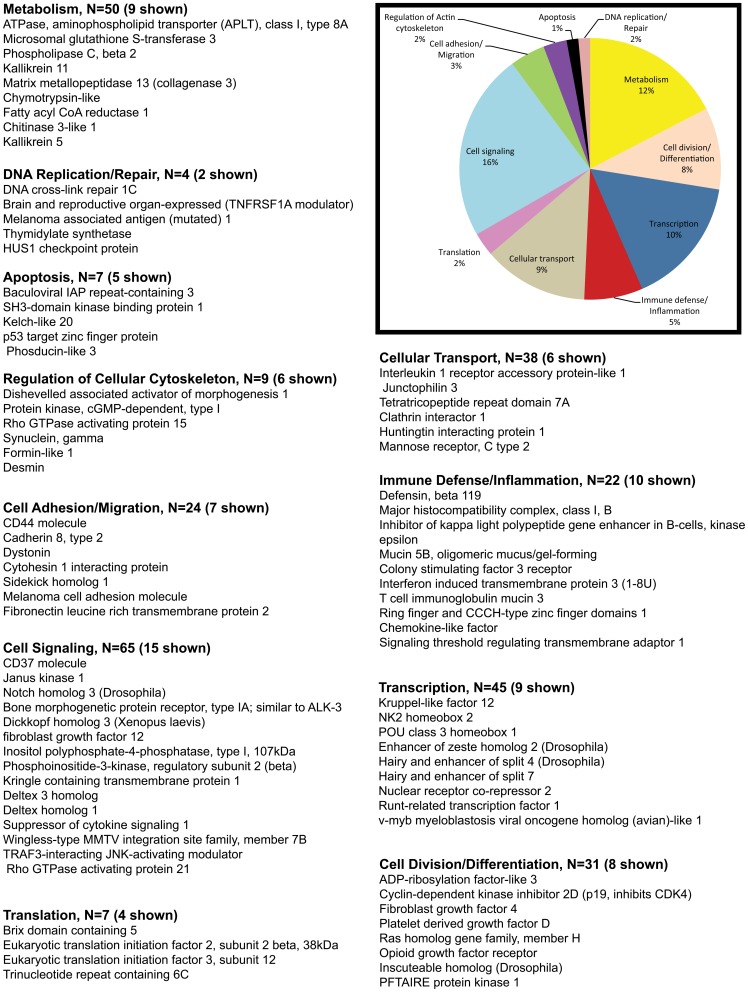
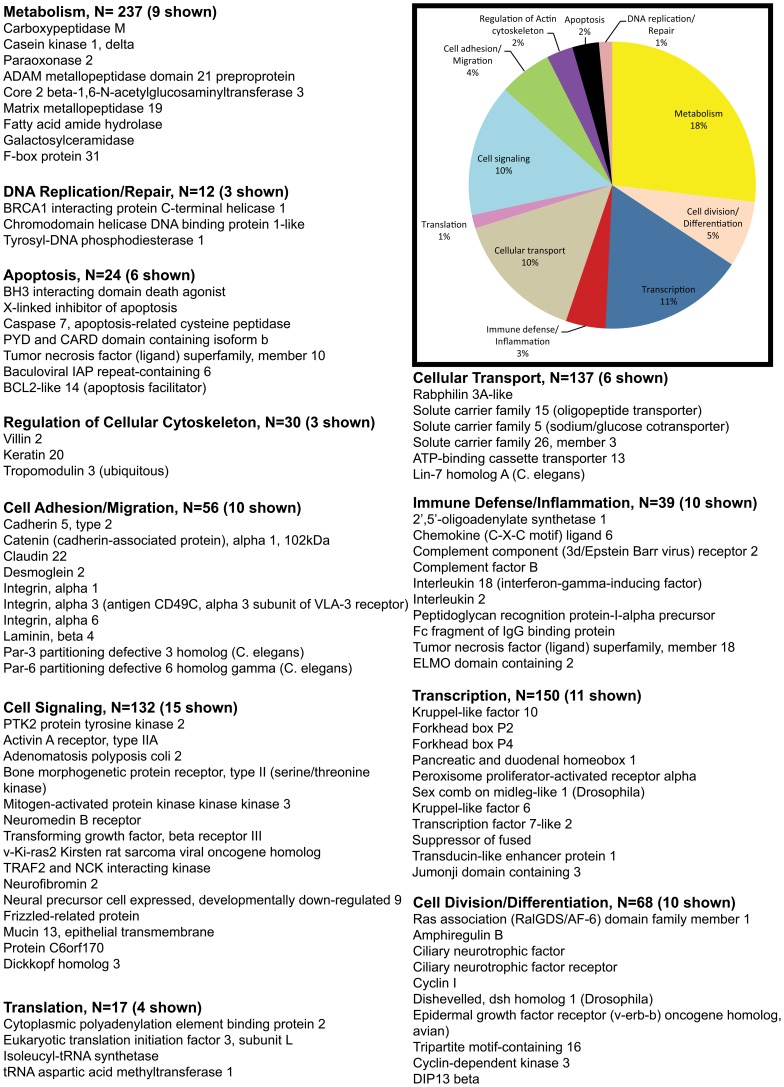
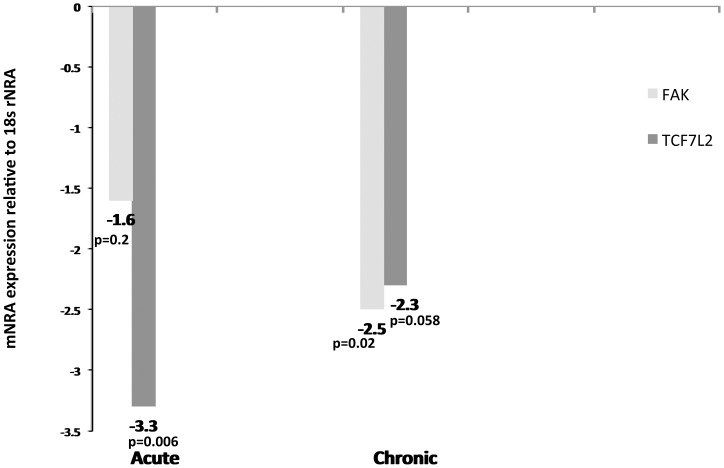
The Gastrointestinal (GI) tract plays a pivotal role in AIDS pathogenesis as it is the primary site for viral transmission, replication and CD4(+) T cell destruction. Accordingly, GI disease (enteropathy) has become a well-known complication and a driver of AIDS progression. To better understand the molecular mechanisms underlying GI disease we analyzed global gene expression profiles sequentially in the intestinal epithelium of the same animals before SIV infection and at 21 and 90 days post infection (DPI). More importantly we obtained sequential excisional intestinal biopsies and examined distinct mucosal components (epithelium. intraepithelial lymphocytes, lamina propria lymphocytes, fibrovascular stroma) separately. Here we report data pertaining to the epithelium. Overall genes associated with epithelial cell renewal/proliferation/differentiation, permeability and adhesion were significantly down regulated (<1.5-7 fold) at 21 and 90DPI. Genes regulating focal adhesions (n = 6), gap junctions (n = 3), ErbB (n = 3) and Wnt signaling (n = 4) were markedly down at 21DPI and the number of genes in each of these groups that were down regulated doubled between 21 and 90DPI. Notable genes included FAK, ITGA6, PDGF, TGFβ3, Ezrin, FZD6, WNT10A, and TCF7L2. In addition, at 90DPI genes regulating ECM-receptor interactions (laminins and ITGB1), epithelial cell gene expression (PDX1, KLF6), polarity/tight junction formation (PARD3B&6B) and histone demethylase (JMJD3) were also down regulated. In contrast, expression of NOTCH3, notch target genes (HES4, HES7) and EZH2 (histone methyltransferase) were significantly increased at 90DPI. The altered expression of genes linked to Wnt signaling together with decreased expression of PDX1, PARD3B, PARD6B and SDK1 suggests marked perturbations in intestinal epithelial function and homeostasis leading to breakdown of the mucosal barrier. More importantly, the divergent expression patterns of EZH2 and JMJD3 suggests that an epigenetic mechanism involving histone modifications may contribute to the massive decrease in gene expression at 90DPI leading to defects in enterocyte maturation and differentiation.
Conflict of interest statement
Figures
Similar articles
-
Longitudinal Examination of the Intestinal Lamina Propria Cellular Compartment of Simian Immunodeficiency Virus-Infected Rhesus Macaques Provides Broader and Deeper Insights into the Link between Aberrant MicroRNA Expression and Persistent Immune Activation.J Virol. 2016 Apr 29;90(10):5003-5019. doi: 10.1128/JVI.00189-16. Print 2016 May 15. J Virol. 2016. PMID: 26937033 Free PMC article.
-
Focused examination of the intestinal lamina propria yields greater molecular insight into mechanisms underlying SIV induced immune dysfunction.PLoS One. 2012;7(4):e34561. doi: 10.1371/journal.pone.0034561. Epub 2012 Apr 12. PLoS One. 2012. PMID: 22511950 Free PMC article.
-
miR-190b is markedly upregulated in the intestine in response to simian immunodeficiency virus replication and partly regulates myotubularin-related protein-6 expression.J Immunol. 2014 Aug 1;193(3):1301-13. doi: 10.4049/jimmunol.1303479. Epub 2014 Jun 30. J Immunol. 2014. PMID: 24981450 Free PMC article.
-
Microbial translocation in the pathogenesis of HIV infection and AIDS.Clin Microbiol Rev. 2013 Jan;26(1):2-18. doi: 10.1128/CMR.00050-12. Clin Microbiol Rev. 2013. PMID: 23297256 Free PMC article. Review.
-
The mucosal immune system and HIV-1 infection.AIDS Rev. 2003 Oct-Dec;5(4):245-52. AIDS Rev. 2003. PMID: 15012003 Review.
Cited by
-
Chronic delta-9-tetrahydrocannabinol (THC) treatment counteracts SIV-induced modulation of proinflammatory microRNA cargo in basal ganglia-derived extracellular vesicles.J Neuroinflammation. 2022 Sep 12;19(1):225. doi: 10.1186/s12974-022-02586-9. J Neuroinflammation. 2022. PMID: 36096938 Free PMC article.
-
Anoikis-related genes as potential prognostic biomarkers in gastric cancer: A multilevel integrative analysis and predictive therapeutic value.IET Syst Biol. 2024 Apr;18(2):41-54. doi: 10.1049/syb2.12088. Epub 2024 Feb 20. IET Syst Biol. 2024. PMID: 38377622 Free PMC article.
-
Longitudinal Examination of the Intestinal Lamina Propria Cellular Compartment of Simian Immunodeficiency Virus-Infected Rhesus Macaques Provides Broader and Deeper Insights into the Link between Aberrant MicroRNA Expression and Persistent Immune Activation.J Virol. 2016 Apr 29;90(10):5003-5019. doi: 10.1128/JVI.00189-16. Print 2016 May 15. J Virol. 2016. PMID: 26937033 Free PMC article.
-
Reversing Gut Damage in HIV Infection: Using Non-Human Primate Models to Instruct Clinical Research.EBioMedicine. 2016 Jan 26;4:40-9. doi: 10.1016/j.ebiom.2016.01.028. eCollection 2016 Feb. EBioMedicine. 2016. PMID: 26981570 Free PMC article. Review.
-
Epigenetic modulation of the NLRP6 inflammasome sensor as a therapeutic modality to reduce necroptosis-driven gastrointestinal mucosal dysfunction in HIV/SIV infection.Cell Commun Signal. 2025 Apr 25;23(1):199. doi: 10.1186/s12964-025-02193-0. Cell Commun Signal. 2025. PMID: 40281523 Free PMC article.
References
-
- Veazey RS, DeMaria M, Chalifoux LV, Shvetz DE, Pauley DR, et al. (1998) Gastrointestinal tract as a major site of CD4+ T cell depletion and viral replication in SIV infection. Science 280: 427–431. - PubMed
-
- Smit-McBride Z, Mattapallil JJ, McChesney M, Ferrick D, Dandekar S (1998) Gastrointestinal T lymphocytes retain high potential for cytokine responses but have severe CD4(+) T-cell depletion at all stages of simian immunodeficiency virus infection compared to peripheral lymphocytes. J Virol 72: 6646–6656. - PMC - PubMed
-
- Mattapallil JJ, Douek DC, Hill B, Nishimura Y, Martin M, et al. (2005) Massive infection and loss of memory CD4+ T cells in multiple tissues during acute SIV infection. Nature 434: 1093–1097. - PubMed
Publication types
MeSH terms
Substances
Grants and funding
LinkOut - more resources
Full Text Sources
Other Literature Sources
Research Materials
Miscellaneous
