

A network approach to psychopathology: new insights into clinical longitudinal data
- PMID: 23593171
- PMCID: PMC3617177
- DOI: 10.1371/journal.pone.0060188
A network approach to psychopathology: new insights into clinical longitudinal data
Erratum in
- PLoS One. 2014;9(4):e96588
Abstract
In the network approach to psychopathology, disorders are conceptualized as networks of mutually interacting symptoms (e.g., depressed mood) and transdiagnostic factors (e.g., rumination). This suggests that it is necessary to study how symptoms dynamically interact over time in a network architecture. In the present paper, we show how such an architecture can be constructed on the basis of time-series data obtained through Experience Sampling Methodology (ESM). The proposed methodology determines the parameters for the interaction between nodes in the network by estimating a multilevel vector autoregression (VAR) model on the data. The methodology allows combining between-subject and within-subject information in a multilevel framework. The resulting network architecture can subsequently be analyzed through network analysis techniques. In the present study, we apply the method to a set of items that assess mood-related factors. We show that the analysis generates a plausible and replicable network architecture, the structure of which is related to variables such as neuroticism; that is, for subjects who score high on neuroticism, worrying plays a more central role in the network. Implications and extensions of the methodology are discussed.
Conflict of interest statement
Figures
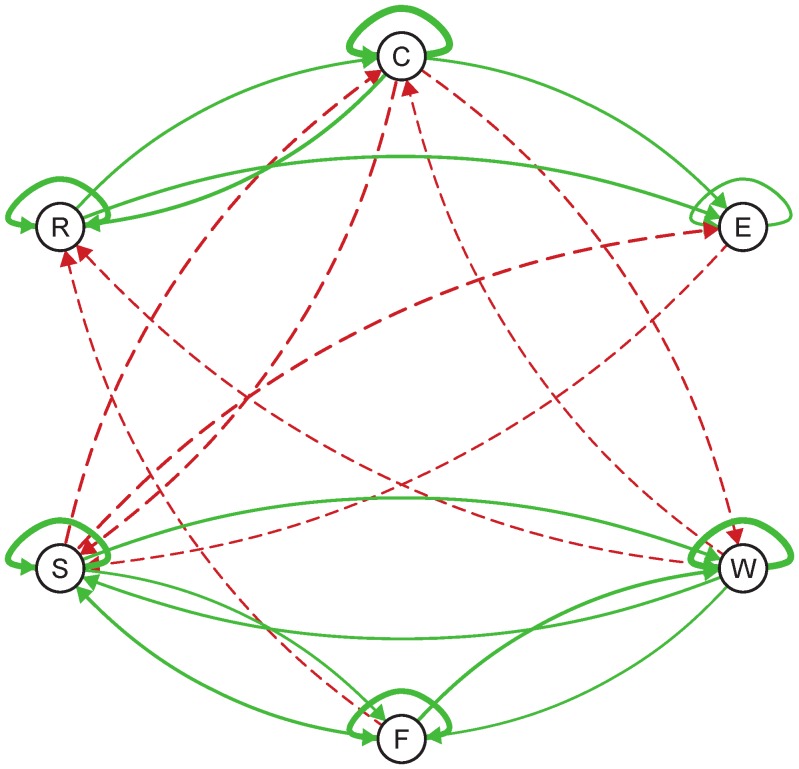
 ), or green, indicating a positive relationship (i.e.,
  ). Furthermore, the strength of the relation from item k to item j (i.e., an extremer value for
  ) is translated into the thickness of the arrows: the thicker the arrow between two nodes, the stronger the nodes or items are related. Note that item responses can also be predicted from the previous state of the item itself. These arrows are the self-loops in the network.
References
-
- Borsboom D (2008) Psychometric perspectives on diagnostic systems. J Clin Psychol 64: 1089–1108 doi: 10.1002/jclp.20503 - DOI - PubMed
-
- Borsboom D, Cramer AOJ, Schmittmann VD, Epskamp S, Waldorp LJ (2011) The small world of psychopathology. PLoS One 6: e27407 doi: 101371/journal.pone.0027407 - PMC - PubMed
-
- Cramer AOJ, Waldorp LJ, van der Maas HLJ, Borsboom D (2010) Comorbidity: A network perspective. Behav Brain Sci 33: 137–193 doi:10.1017/S0140525X09991567 - DOI - PubMed
-
- Cramer AOJ, Borsboom D, Aggen SH, Kendler KS (2012) The pathoplasticity of dysphoric episodes: Differential impact of stressful life events on the pattern of depressive symptom inter-correlations. Psychol Med 42: 957–967 doi:10.1017/S003329171100211X - DOI - PMC - PubMed
-
- Kendler KS (2012) Levels of explanation in psychiatric and substance use disorders: Implications for the development of an etiologically based nosology. Mol Psychiatry 17: 11–21 doi:10.1038/mp.2011.70 - DOI - PMC - PubMed
MeSH terms
LinkOut - more resources
Full Text Sources
Other Literature Sources
Medical
