

Variation in dietary salt intake induces coordinated dynamics of monocyte subsets and monocyte-platelet aggregates in humans: implications in end organ inflammation
- PMID: 23593194
- PMCID: PMC3617205
- DOI: 10.1371/journal.pone.0060332
Variation in dietary salt intake induces coordinated dynamics of monocyte subsets and monocyte-platelet aggregates in humans: implications in end organ inflammation
Abstract
Background: Monocyte activation and tissue infiltration are quantitatively associated with high-salt intake induced target organ inflammation. We hypothesized that high-salt challenge would induce the expansion of CD14++CD16+ monocytes, one of the three monocyte subsets with a pro-inflammatory phenotype, that is associated with target organ inflammation in humans.
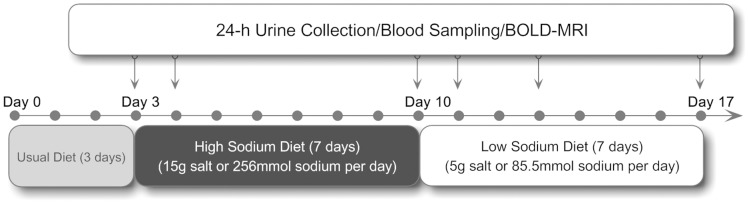
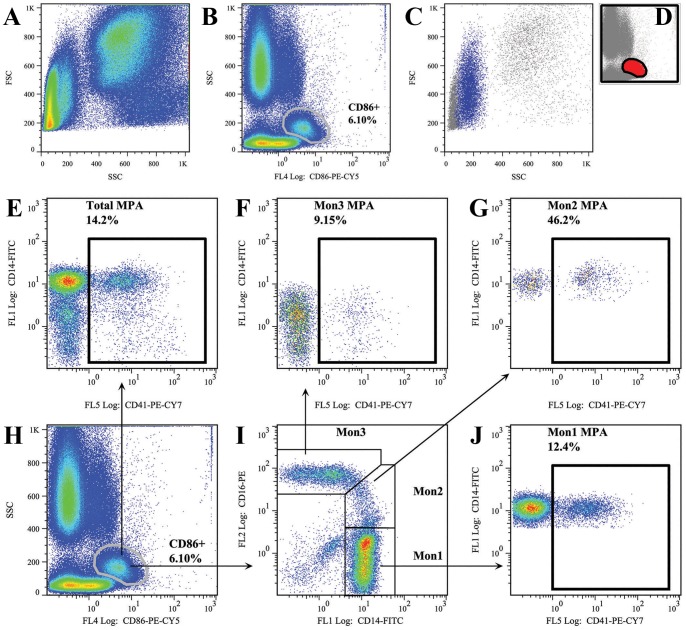
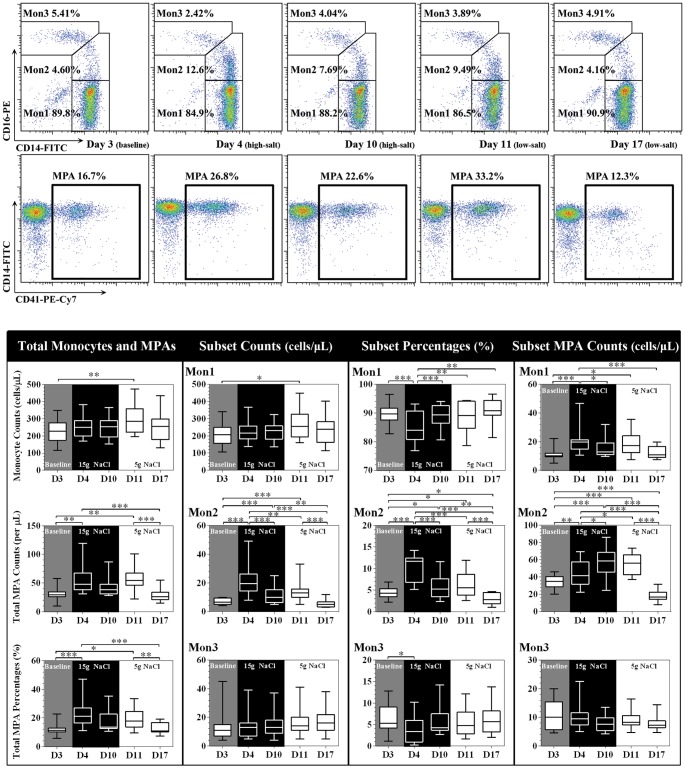
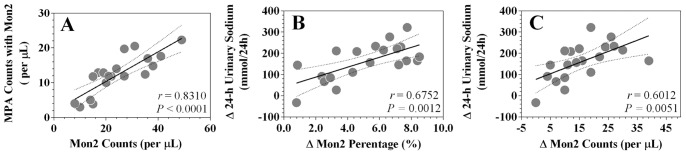
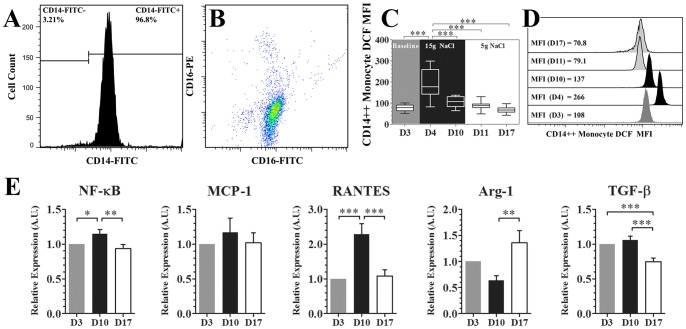
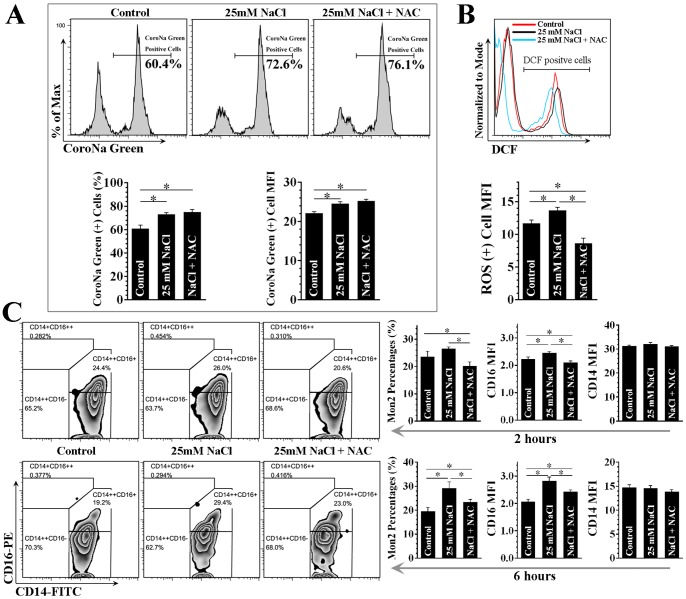
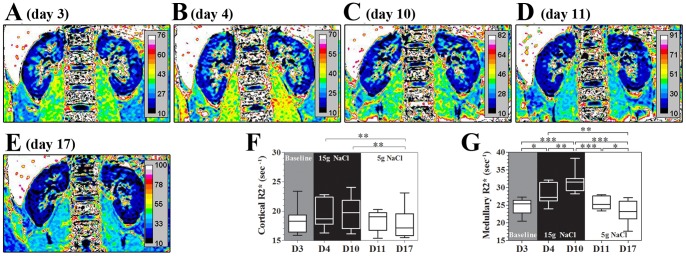
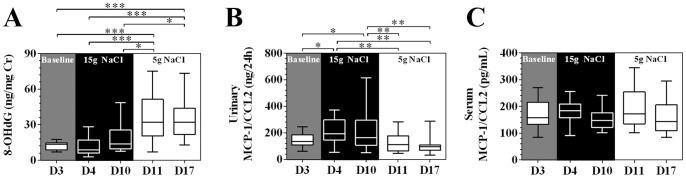
Methodology/principal findings: A dietary intervention study was performed in 20 healthy volunteers, starting with a 3-day usual diet and followed with a 7-day high-salt diet (≥15 g NaCl/day), and a 7-day low-salt diet (≤5 g NaCl/day). The amounts of three monocyte subsets ("classical" CD14++CD16-, "intermediate" CD14++CD16+ and "non-classical" CD14+CD16++) and their associations with monocyte-platelet aggregates (MPAs) were measured by flow cytometry. Blood oxygen level-dependent magnetic resonance imaging (BOLD-MRI) was used to evaluate renal hypoxia. Switching to a high-salt diet resulted in CD14++ monocyte activation and a rapid expansion of CD14++CD16+ subset and MPAs, with a reciprocal decrease in the percentages of CD14++CD16- and CD14+CD16++ subsets. In vitro study using purified CD14++ monocytes revealed that elevation in extracellular [Na(+)] could lead to CD14++CD16+ expansion via a ROS dependent manner. In addition, high-salt intake was associated with progressive hypoxia in the renal medulla (increased R2* signal) and enhanced urinary monocyte chemoattractant protein-1 (MCP-1) excretion, indicating a temporal and spatial correlation between CD14++CD16+ subset and renal inflammation. The above changes could be completely reversed by a low-salt diet, whereas blood pressure levels remained unchanged during dietary intervention.
Conclusions/significance: The present work demonstrates that short-term increases in dietary salt intake could induce the expansion of CD14++CD16+ monocytes, as well as an elevation of MPAs, which might be the underlying cellular basis of high-salt induced end organ inflammation and potential thromboembolic risk. In addition, this process seems largely unrelated to changes in blood pressure levels. This finding provides novel links between dietary salt intake, innate immunity and end organ inflammation.
Conflict of interest statement
Figures
Similar articles
-
High-salt intake induced visceral adipose tissue hypoxia and its association with circulating monocyte subsets in humans.Obesity (Silver Spring). 2014 Jun;22(6):1470-6. doi: 10.1002/oby.20716. Epub 2014 Feb 19. Obesity (Silver Spring). 2014. PMID: 24493236
-
Monocyte-platelet interaction induces a pro-inflammatory phenotype in circulating monocytes.PLoS One. 2011;6(10):e25595. doi: 10.1371/journal.pone.0025595. Epub 2011 Oct 12. PLoS One. 2011. PMID: 22022418 Free PMC article.
-
The Kinetics of Circulating Monocyte Subsets and Monocyte-Platelet Aggregates in the Acute Phase of ST-Elevation Myocardial Infarction: Associations with 2-Year Cardiovascular Events.Medicine (Baltimore). 2016 May;95(18):e3466. doi: 10.1097/MD.0000000000003466. Medicine (Baltimore). 2016. PMID: 27149446 Free PMC article.
-
Acute Alcohol Intoxication Modulates Monocyte Subsets and Their Functions in a Time-Dependent Manner in Healthy Volunteers.Front Immunol. 2021 May 18;12:652488. doi: 10.3389/fimmu.2021.652488. eCollection 2021. Front Immunol. 2021. PMID: 34084163 Free PMC article.
-
The CD14++CD16+ monocyte subset and monocyte-platelet interactions in patients with ST-elevation myocardial infarction.J Thromb Haemost. 2012 Jul;10(7):1231-41. doi: 10.1111/j.1538-7836.2011.04603.x. J Thromb Haemost. 2012. PMID: 22212813
Cited by
-
A Systematic Review of the Impact of Dietary Sodium on Autoimmunity and Inflammation Related to Multiple Sclerosis.Adv Nutr. 2019 Sep 1;10(5):902-910. doi: 10.1093/advances/nmz032. Adv Nutr. 2019. PMID: 31079157 Free PMC article.
-
Monocyte subsets and monocyte-platelet aggregates in patients with unstable angina.J Thromb Thrombolysis. 2014 Nov;38(4):439-46. doi: 10.1007/s11239-014-1083-4. J Thromb Thrombolysis. 2014. PMID: 24844803
-
High-fat and high-sodium diet induces metabolic dysfunction in the absence of obesity.Obesity (Silver Spring). 2021 Nov;29(11):1868-1881. doi: 10.1002/oby.23264. Epub 2021 Sep 21. Obesity (Silver Spring). 2021. PMID: 34549547 Free PMC article.
-
Role of Oxidative Stress in Vascular Low-Grade Inflammation Initiation Due to Acute Salt Loading in Young Healthy Individuals.Antioxidants (Basel). 2022 Feb 23;11(3):444. doi: 10.3390/antiox11030444. Antioxidants (Basel). 2022. PMID: 35326095 Free PMC article.
-
Could Sodium Chloride be an Environmental Trigger for Immune-Mediated Diseases? An Overview of the Experimental and Clinical Evidence.Front Physiol. 2018 Apr 24;9:440. doi: 10.3389/fphys.2018.00440. eCollection 2018. Front Physiol. 2018. PMID: 29740348 Free PMC article. Review.
References
-
- Coffman TM (2011) Under pressure: the search for the essential mechanisms of hypertension. Nat Med 17: 1402–1409. - PubMed
-
- Hilgers KF (2002) Monocytes/macrophages in hypertension. J Hypertens 20: 593–596. - PubMed
-
- Muller DN, Kvakan H, Luft FC (2011) Immune-related effects in hypertension and target-organ damage. Curr Opin Nephrol Hypertens 20: 113–117. - PubMed
-
- Ziegler-Heitbrock L, Ancuta P, Crowe S, Dalod M, Grau V, et al. (2010) Nomenclature of monocytes and dendritic cells in blood. Blood 116: e74–80. - PubMed
Publication types
MeSH terms
Substances
LinkOut - more resources
Full Text Sources
Other Literature Sources
Medical
Research Materials
Miscellaneous
