Female fertilization: effects of sex-specific density and sex ratio determined experimentally for Colorado potato beetles and Drosophila fruit flies
- PMID: 23593206
- PMCID: PMC3625176
- DOI: 10.1371/journal.pone.0060381
Female fertilization: effects of sex-specific density and sex ratio determined experimentally for Colorado potato beetles and Drosophila fruit flies
Abstract
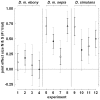
If males and females affect reproduction differentially, understanding and predicting sexual reproduction requires specification of response surfaces, that is, two-dimensional functions that relate reproduction to the (numeric) densities of both sexes. Aiming at rigorous measurement of female per capita fertilization response surfaces, we conducted a multifactorial experiment and reanalyzed an extensive data set. In our experiment, we varied the density of male and female Leptinotarsa decemlineata (Colorado potato beetles) by placing different numbers of the two sexes on enclosed Solanum tuberosum (potato plants) to determine the proportion of females fertilized after 3 or 22 hours. In the reanalysis, we investigated how the short-term fertilization probability of three Drosophila strains (melanogaster ebony, m. sepia, and simulans) depended on adult sex ratio (proportion of males) and total density. The fertilization probability of female Leptinotarsa decemlineata increased logistically with male density, but not with female density. These effects were robust to trial duration. The fertilization probability of female Drosophila increased logistically with both sex ratio and total density. Treatment effects interacted in m. sepia, and simulans. These findings highlight the importance of well-designed, multifactorial experiments and strengthen previous experimental evidence for the relevance of sex-specific densities to understanding and prediction of female fertilization probability.
Conflict of interest statement
Figures


Similar articles
-
Potato field colonization by low-density populations of Colorado potato beetle as a function of crop rotation distance.J Econ Entomol. 2008 Oct;101(5):1575-83. doi: 10.1603/0022-0493(2008)101[1575:pfcblp]2.0.co;2. J Econ Entomol. 2008. PMID: 18950039
-
Pymetrozine causes a nontarget pest, the Colorado potato beetle (Coleoptera: Chrysomelidae), to leave potato plants.J Econ Entomol. 2008 Feb;101(1):74-80. doi: 10.1603/0022-0493(2008)101[74:pcanpt]2.0.co;2. J Econ Entomol. 2008. PMID: 18330119
-
Flight take-off performance of Colorado potato beetle in relation to potato phenology.J Econ Entomol. 2008 Feb;101(1):56-60. doi: 10.1603/0022-0493(2008)101[56:ftpocp]2.0.co;2. J Econ Entomol. 2008. PMID: 18330116
-
Extraordinary Adaptive Plasticity of Colorado Potato Beetle: "Ten-Striped Spearman" in the Era of Biotechnological Warfare.Int J Mol Sci. 2016 Sep 13;17(9):1538. doi: 10.3390/ijms17091538. Int J Mol Sci. 2016. PMID: 27649141 Free PMC article. Review.
-
The Red Queen in a potato field: integrated pest management versus chemical dependency in Colorado potato beetle control.Pest Manag Sci. 2015 Mar;71(3):343-56. doi: 10.1002/ps.3826. Epub 2014 Jun 6. Pest Manag Sci. 2015. PMID: 24817433 Review.
Cited by
-
Bias in sex ratios and polyandry rate in reproduction of Leptinotarsa decemlineata.Sci Rep. 2022 Dec 14;12(1):21637. doi: 10.1038/s41598-022-26177-z. Sci Rep. 2022. PMID: 36517541 Free PMC article.
-
Can't live with them, can't live without them? Balancing mating and competition in two-sex populations.Proc Biol Sci. 2017 Oct 25;284(1865):20171999. doi: 10.1098/rspb.2017.1999. Proc Biol Sci. 2017. PMID: 29070729 Free PMC article.
-
Adult sex ratios and their implications for cooperative breeding in birds.Philos Trans R Soc Lond B Biol Sci. 2017 Sep 19;372(1729):20160322. doi: 10.1098/rstb.2016.0322. Philos Trans R Soc Lond B Biol Sci. 2017. PMID: 28760763 Free PMC article. Review.
-
Adult sex ratios: causes of variation and implications for animal and human societies.Commun Biol. 2022 Nov 19;5(1):1273. doi: 10.1038/s42003-022-04223-w. Commun Biol. 2022. PMID: 36402823 Free PMC article. Review.
-
Nocturnal surveys of lined seahorses reveal increased densities and seasonal recruitment patterns.Ecol Evol. 2023 Jan 11;13(1):e9573. doi: 10.1002/ece3.9573. eCollection 2023 Jan. Ecol Evol. 2023. PMID: 36644702 Free PMC article.
References
-
- Rankin DJ, Kokko H (2006) Do males matter? The role of males in population dynamics. Oikos 116: 335–348.
-
- Wallace B (1985) Mating kinetics in Drosophila . Behav Sci 30: 149–154. - PubMed
-
- Dowse HB, Ringo JM, Barton KM (1986) A model describing the kinetics of mating in Drosophila . J Theor Biol 121: 173–183. - PubMed
-
- Sih A, Krupa JJ (1995) Interacting effects of predation risk and male and female density on male-female conflicts and mating dynamics of stream water striders. Behav Ecol 6: 316–325.
Publication types
MeSH terms
LinkOut - more resources
Full Text Sources
Other Literature Sources
Molecular Biology Databases

