. 2013 Apr 11;8(4):e60546.
doi: 10.1371/journal.pone.0060546. Print 2013.

Autophagy attenuates diabetic glomerular damage through protection of hyperglycemia-induced podocyte injury

Affiliations

Autophagy attenuates diabetic glomerular damage through protection of hyperglycemia-induced podocyte injury

Li Fang et al. PLoS One. .

Abstract

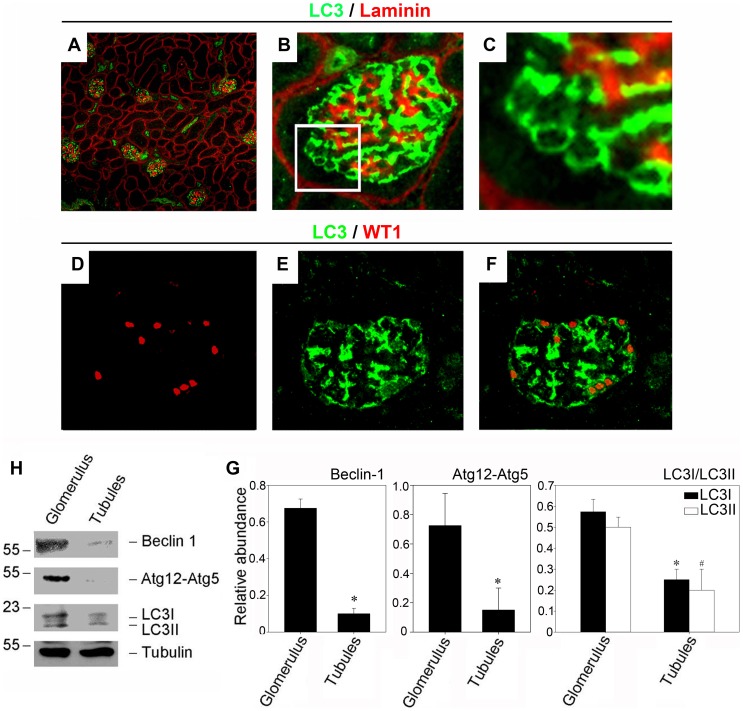
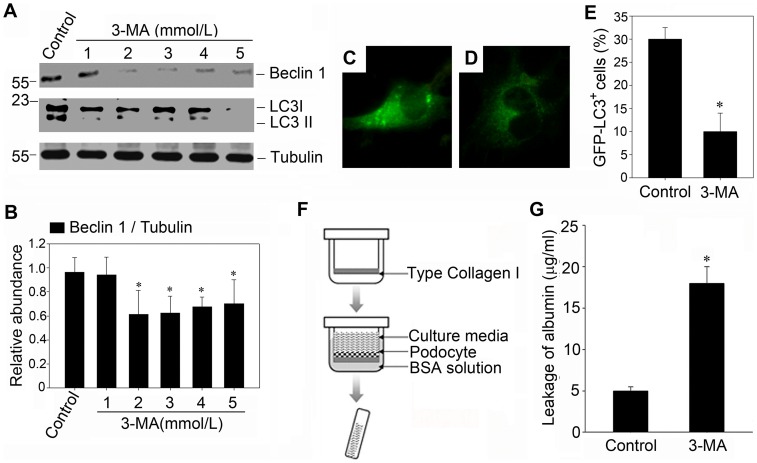
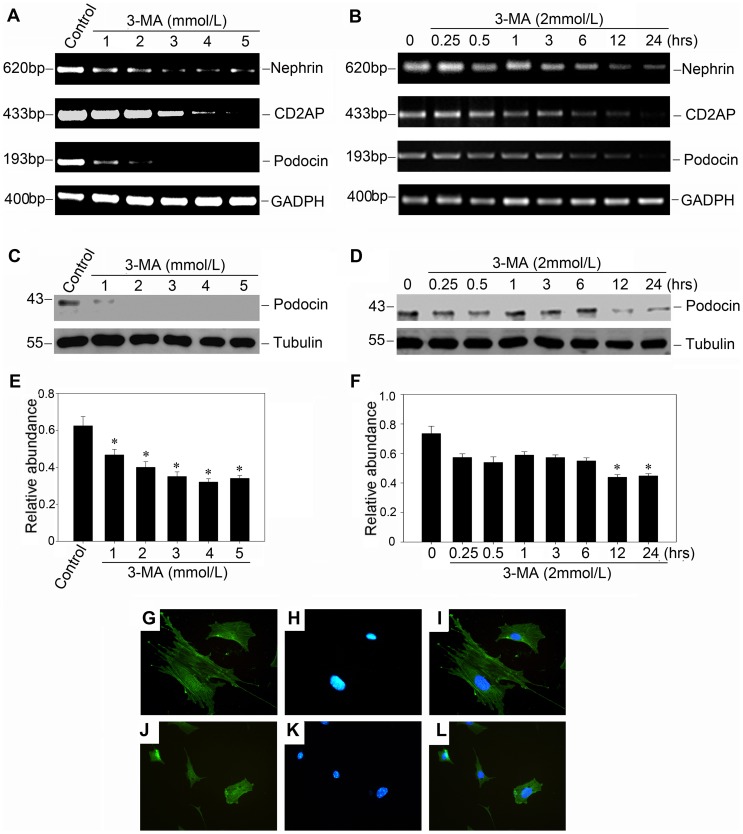
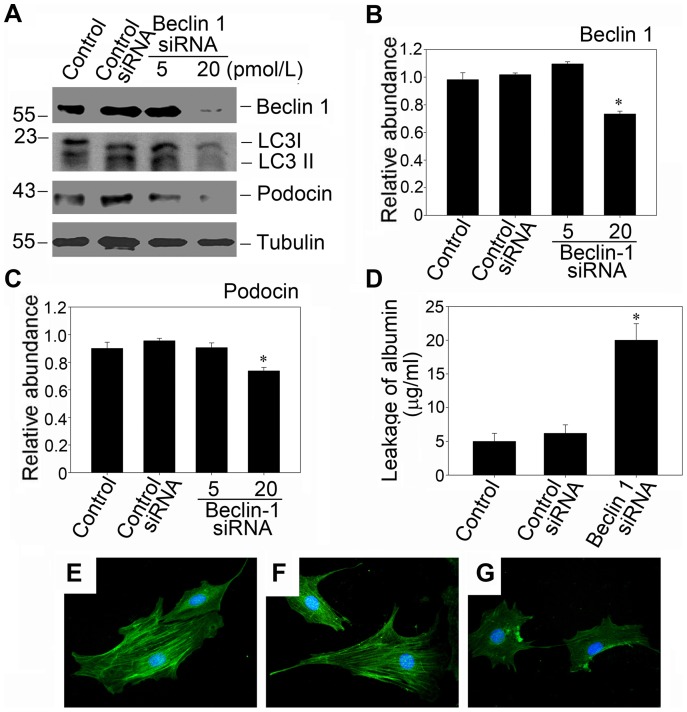
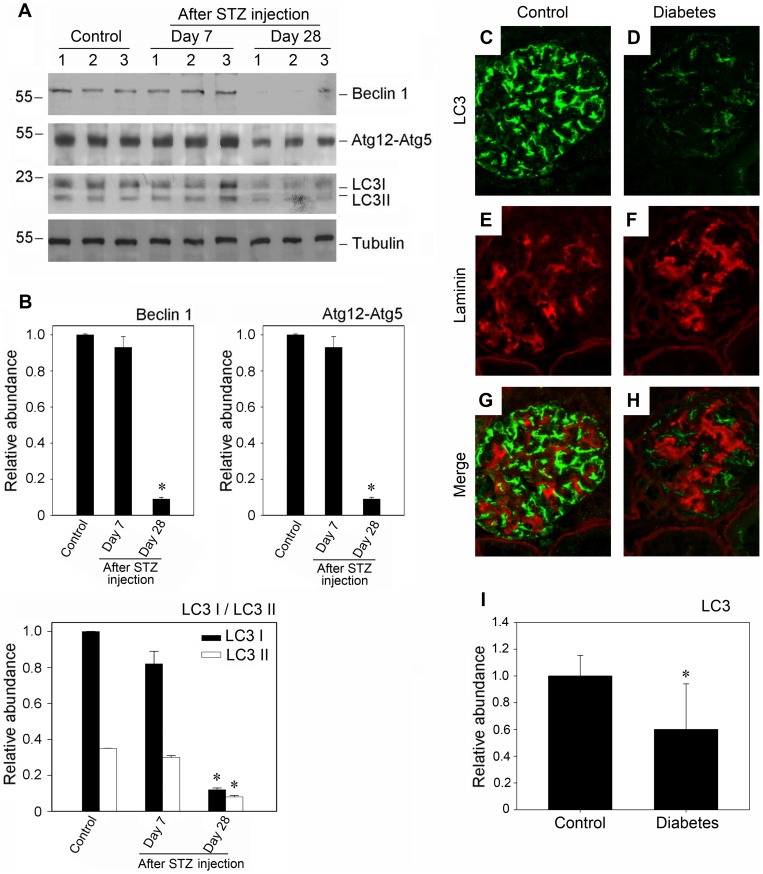
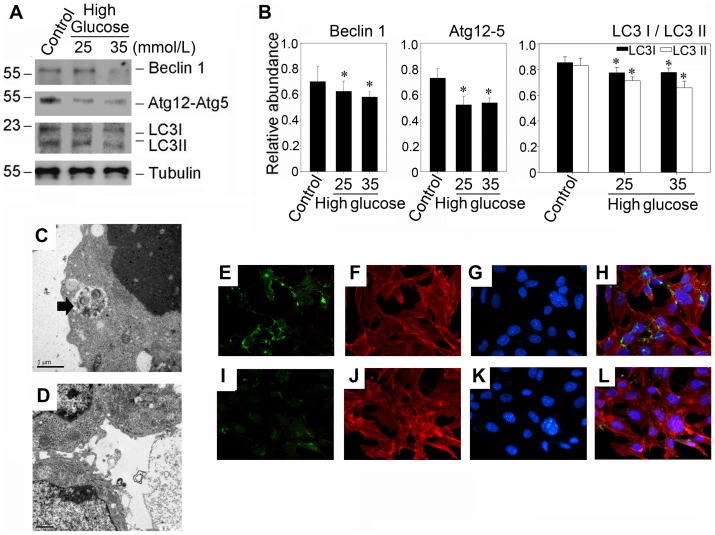
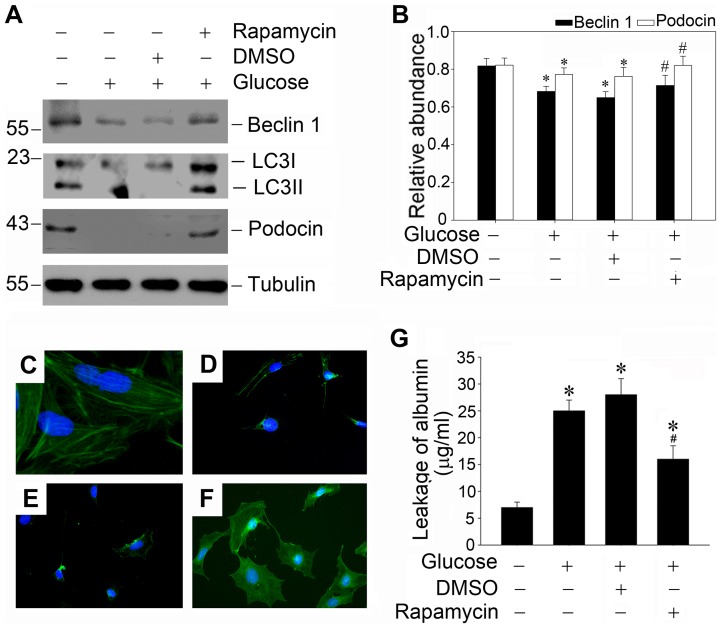
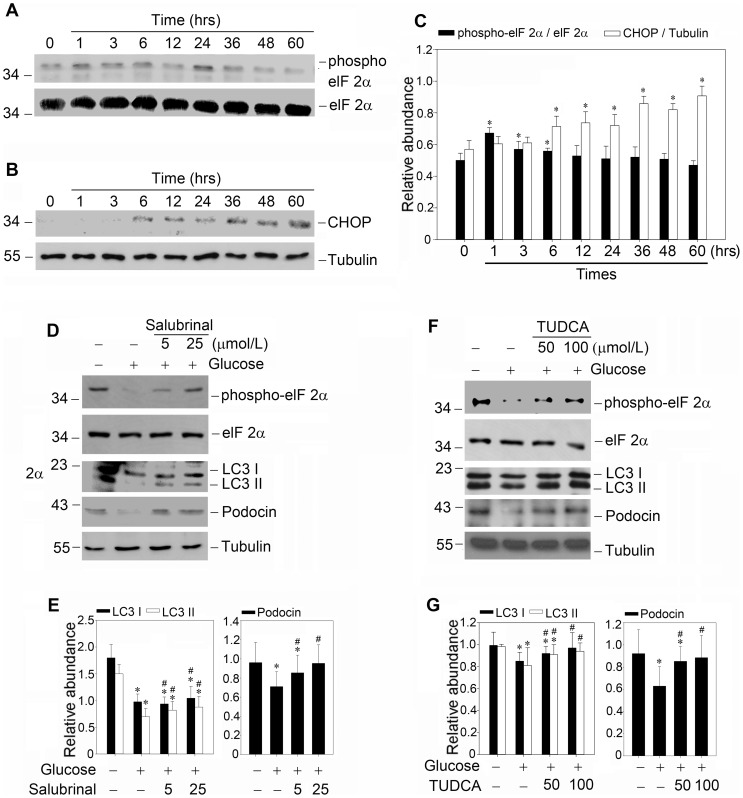
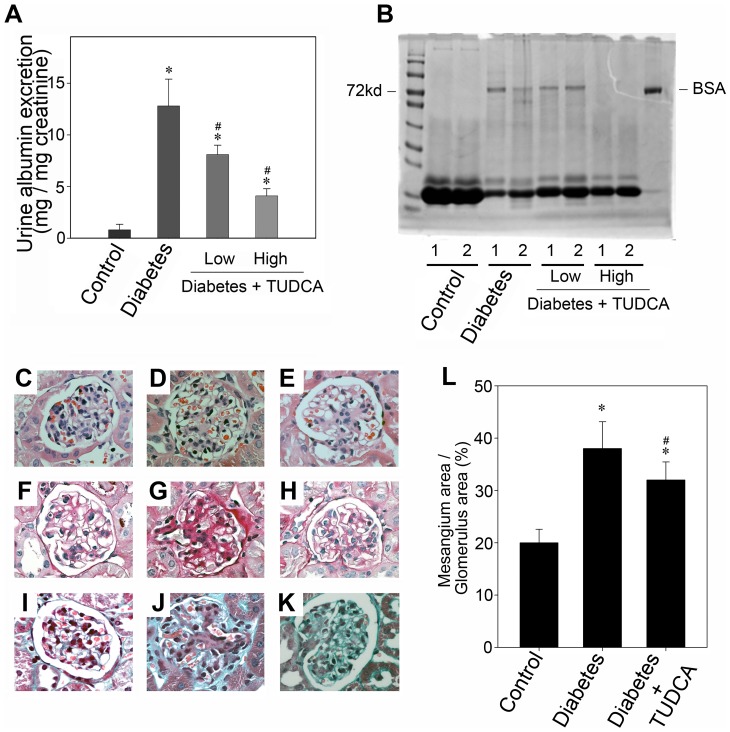
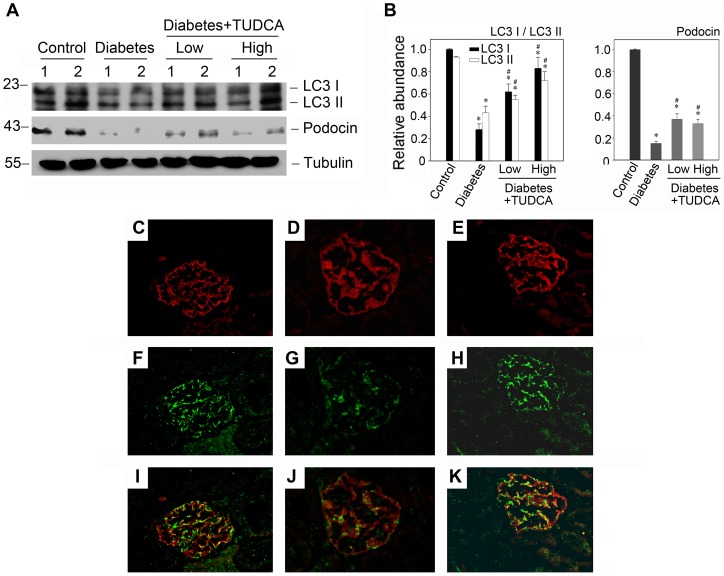
Despite the recent attention focused on the important role of autophagy in maintaining podocyte homeostasis, little is known about the changes and mechanisms of autophagy in podocyte dysfunction under diabetic condition. In this study, we investigated the role of autophagy in podocyte biology and its involvement in the pathogenesis of diabetic nephropathy. Podocytes had a high basal level of autophagy. And basal autophagy inhibition either by 3-methyladenenine (3-MA) or by Beclin-1 siRNA was detrimental to its architectural structure. However, under diabetic condition in vivo and under high glucose conditions in vitro, high basal level of autophagy in podocytes became defective and defective autophagy facilitated the podocyte injury. Since the dynamics of endoplasmic reticulum(ER) seemed to play a vital role in regulating the autophagic flux, the results that Salubrinal/Tauroursodeoxycholic acid (TUDCA) could restore defective autophagy further indicated that the evolution of autophagy may be mediated by the changes of cytoprotective output in the ER stress. Finally, we demonstrated in vivo that the autophagy of podocyte was inhibited under diabetic status and TUDCA could improve defective autophagy. Taken together, these data suggested that autophagy might be interrupted due to the failure of ER cytoprotective capacity upon high glucose induced unmitigated stress, and the defective autophagy might accelerate the irreparable progression of diabetic nephropathy.


Conflict of interest statement

Competing Interests: The authors have declared that no competing interests exist.

Figures

Figure 1
Figure 1. CD-1 mice exhibit high basal autophagy flux in glomerular podocytes.
(A–C): Kidney section were immunostained with anti-LC3 antibody (green) to identify autophagosomes, followed by staining with anti-Laminin antibody (red) to sever as a marker for the basement membrane. (A): Low power (×100) field micrograph showing the localization of autophagosomes in the kidney. (B and C): High power (×400) field micrograph further demonstrated the autophagosomes (stained with the anti-LC3 antibody, green) were localized mainly on the epithelial side of the glomerular basement membrane (stained with the anti-Laminin antibody, red) where the podocytes reside. (D–F): Immunofluorescence staining demonstrates the occurrence of autophagy in podocytes, as illustrated by colocalization of WT-1 staining to recognize podocytes (D) and LC3 staining to identify autophagosomes (E). Merging the LC3 and WT-1 staining images is presented in F. (H and G): Western blot analysis shows a comparable protein abundance of autophagy related proteins such as Beclin-1, Atg12-5, and LC3 in the glomeruli lysates and the tubule lysates. The lysates were immunoblotted with Ab's against Beclin-1, Atg12-5, LC3 and α-tubulin, respectively. The relative abundances are presented in B after normalization with α-tubulin. * P<0.05 (n = 3).
Figure 2
Figure 2. Inhibition of basal autophagy impairs the filtration barrier function of podocyte monolayer.
(A): Western blot analysis confirms the inhibitory effect of 3-MA on autophagy in culture podocytes. Mouse podocytes were incubated with increasing amounts of 3-MA for 24 hours. (B): Graphical presentation shows the relative abundances of Beclin-1 after normalization with α-tubulin. Data are presented as mean ± SEM of three independent experiments. *P<0.05 vs. normal control; (C and D): Fluorescence staining of GFP-LC3 (400× magnification) in response to 3-MA treatment. Following transfection with GFP-LC3 plasmid as described in Materials and Methods, cells were treated without or with 3-MA (2 mmol/L) for 24 hours. (C): control group; (D): podocytes incubated with 3-MA for 24 hours. (E): Quantification of GFP-LC3 dotted cells after 3-MA treatment. A minimum of 100 GFP-LC3–transfected cells were counted. * P<0.05 vs. control; (F) Schematic depiction of the paracellular permeability influx assay. Podocyte monolayer on collagen-coated transwell filters was incubated without or with 3-MA (2 mmol/L) for 24 h, and albumin permeability across podocyte monolayer was then determined. (G): Graphic presentation of the albumin influx across the podocyte monolayer. Data are presented as mean ± SEM of three independent experiments. * P<0.05 vs. control.
Figure 3
Figure 3. Autophagy inhibition by 3-MA suppresses the protein and mRNA expression of podocyte slit diaphragm proteins in a dose-dependent and time-dependent manner.
(A) and (B): RT-PCR demonstrates that 3-MA (2 mmol/L) inhibited the mRNA expression of podocyte slit diaphragm proteins such as nephrin, CD2AP and podocin in a dose-dependent and time-dependent manner. Podocytes were incubated with either increasing amounts of 3-MA for 24 hours (A), or the same concentration of 3-MA (2 mmol/L) for various periods of time as indicated (B). (C) and (D): Western blot analysis shows that 3-MA (2 mmol/L) inhibited podocin protein expression in a dose- and time-dependent manner. Cell lysates were immunoblotted with Ab's against podocin and α-tubulin, respectively. (E) and (F): Quantitative determination of podocin protein abundance after normalization with α-tubulin. Data are presented as mean ± SEM of three independent experiments. *P<0.05 vs. normal control; (G–L): Immunofluorescence staining shows the localization of podocin in the control and 3-MA treated podocytes. (G–I): control group; (J–L): podocytes incubated with 3-MA (2 mmol/L) for 24 hours.
Figure 4
Figure 4. Autophagy inhibition by Beclin1 siRNA also decreases the expression of podocin and impairs the filtration barrier of podocyte monolayer.
(A): Western blot analysis shows that beclin-1 silencing which was achieved by using 20 pmol/L siRNA significantly inhibited podocin protein expression. Mouse podocytes were transfected with beclin-1 siRNA and then incubated for 24 hours. (B and C): Quantitative determination of beclin-1 protein (B) and podocin protein (C) abundance after normalization with α-tubulin. Data are presented as mean ± SEM of three independent experiments. *P<0.05 vs. normal control; (D) Graphic presentation of the albumin influx across podocyte monolayer. Podocyts monolayer on collagen-coated Transwell filters was transfected with control siRNA or beclin-1 siRNA and then incubated for 24 hours, and albumin permeability across podocyte monolayer was determined. Values are means ± SEM; n = 3. *P<0.05 vs. control; (E–G): Representative photographs of podocin visualized by indirect immunofluorescence staining in the control, the control siRNA transfected cells and the beclin-1 siRNA transfected cells. (E): control; (F): podocytes transfected with control siRNA for 24 hours; (G): podocytes transfected with beclin-1 siRNA (20 pmol/L) for 24 hours.
Figure 5
Figure 5. Suppression of autophagy in diabetic glomerular podocytes.
(A) Western blot analysis shows the level of autophagy related proteins in diabetic glomerular. The glomerular lysates were blotted with specific antibodies against Beclin-1, Atg12-5 and LC3, respectively. Samples from two individual animals were used at each timepoint. (B) Quantitative determination of Beclin-1, Atg12-5 and LC3 protein abundance after normalization with α-tubulin. *P<0.05 (n = 3). (C–D) Immunofluorescence staining shows the changes of autophagosomes in the diabetic glomerular (400× magnification). Kidney section were immunostained with anti-LC3 antibody (green) to identify autophagosomes, followed by staining with anti-Laminin antibody (red) to sever as a marker for the basement membrane.(C, E and G): control group; (D, F and H): the group of 28 day diabetic mouse. (I): Quantification of LC3 immunofluorescence staining in nondiabetic glomeruli and diabetic glomeruli. 30 glomeruli were evaluated for each experimental animal (n = 5) through the middle part of the kidney. Glomeruli that did not have a glomerular tuft or that were sectioned close to the edge were disregarded. Data are presented as mean ± SEM. *P<0.05 vs. normal control.
Figure 6
Figure 6. High glucose suppresses the expression of Beclin-1, Atg12-5 and LC3 in murine podocytes.
(A). Western blot results demonstrated that high glucose (25 mmol/L and 35 mmol/L) suppresses the expression of Beclin-1, Atg12-5 and LC3. Murine podocytes were treated with high glucose (25 mmol/L and 35 mmol/L) for 48 hours. (B): Quantitative determination of the relative abundance of Beclin-1, Atg12-5 and LC3. Data are presented as mean ± SEM of three independent experiments. *P<0.05 vs. normal control; (C and D): Representative electronic micrographs shows autophagosomal structures in podocytes treated without or with high glucose (25 mM) for 48 hours. The arrows indicate autophagosomes. Bar 1 μm. (C): control group; (D): high glucose group incubated in 25 mmol/L D-glucose for 48 hours; (E–L): Double imunofluorescence staining shows the localization of LC3 (green, first column); β-actin (red, second column), and cell nucleus (blue, third column) in podocytes treated without or with high glucose (25 mM) for 48 hours. Merging of β-actin, LC3 and cell nucleus staining is presented in fourth column (H and L). (E, F, G and H): control group; (I, J, K and L): high glucose group incubated in 25 mmol/L D-glucose for 48 hours.
Figure 7
Figure 7. Rapamycin restores defective autophagy induced by high glucose and protects against high glucose induced podocyte injury.
(A) Western blot analysis shows that low concentration of rapamycin (1 ng/ml) could restore defective autophagy induced by high glucose and protect against podocyte injury. Podocytes were pretreated with DMSO or 1 ng/ml rapamycin for 0.5 h, and followed by incubation with high glucose (25 mmol/L) for 48 hours. Whole-cell lysates were immunoblotted with specific antibodies against Beclin-1, LC3, podocin or α-tubulin, respectively. (B): Quantitative determination of Beclin-1 protein and podocin protein abundance after normalization with α-tubulin. Data are presented as mean ± SEM of three independent experiments. *P<0.05 vs. normal control; # P<0.05 vs. high-glucose-treated group. (C–F): Representative photographs of podocin visualized by indirect immunofluorescence staining in the control and treated podocytes as indicated. (C): control group; (D): high-glucose-treated group; (E): DMSO pretreated + high glucose treated group; (F): rapamycin pretreated + high glucose treated group; (G): Graphic presentation of the albumin influx across podocyte monolayer. Podocyte monolayer on collagen-coated transwell filters was incubated with various treatments as indicated for 48 hours. Data are presented as mean ± SEM of three independent experiments. * P<0.05 vs. normal control; # P<0.05 vs. high-glucose-treated group.
Figure 8
Figure 8. Enhancement of cytoprotective output of high glucose induced endoplasmic reticulum stress could restore defective autophagy.
(A and B): Kinetics of elF2α and CHOP in high glucose induced endoplasmic reticulum stress. Murine podocytes were treated with high glucose (25 mmol/L) for the indicated times, and elF2α phosphorylation and CHOP expression were detected by immunoblotting; (C): Quantitative determination of the phosphorylation of elF2α and CHOP protein abundance after normalization with α-tubulin. Data are presented as mean ± SEM of three independent experiments. *P<0.05 vs. control; (D): Salubrinal could restore high glucose suppressed autophagy and podocin expression. Podocytes were pretreated with salubrinal for 0.5 h, followed by incubation with high glucose (25 mmol/L) for 48 hours. Whole-cell lysates were immunoblotted with specific antibodies against phosphorylated elF2α, elF2α, LC3, podocin or α-tubulin, respectively. (F): Taurine-conjugated ursodeoxycholic acid (TUDCA) also restores high glucose suppressed autophagy and podocin expression. Podocytes were pretreated with TUDCA for 0.5 h, followed by incubation with high glucose (25 mmol/L) for 48 hours. (E and G): Quantitative determination of the relative abundance of LC3 and podocin among different groups. Data are presented as mean ± SEM of three independent experiments. *P<0.05 vs. normal control; # P<0.05 vs. high-glucose-treated group.
Figure 9
Figure 9. TUDCA attenuates albuminuria and improves histopathological lesion in diabetic mice.
(A) TUDCA attenuates albuminuria in diabetic mice. Shown is graphic presentation of urinary albumin/creatinine ratio. Data are presented as means ± SEM of three experiments. n = 6; * P<0.05 vs. normal control. # P<0.05 vs. the group of 28 day diabetic mouse. (B) Representative SDS-PAGE shows the urine proteins in different groups of mice as indicated. Numbers (1 and 2) denote each individual animal in a given group. (C–K) The light microscopic appearance of representative glomeruli (400× magnification) is shown stained with H&E (C–E), PAS (F–H), and Masson's trichrome (I–K). The left column (C, F and I): control group; The second column (D, G and J): diabetic group; The third column (E, H and K): diabetic group treated with 500 mg/kg/day TUDCA. (L): Quantification of extracellular mesangial matrix area in relation to glomerular tuft area. Results are expressed as average percentage of glomerular area occupied by the mesangial matrix. 30 glomeruli were evaluated for each experimental animal (n = 6) through the middle part of the kidney. * P<0.05 vs. normal control. # P<0.05 vs. the group of 28 day diabetic mouse.
Figure 10
Figure 10. TUDCA restores the suppressed autophagy in diabetic mice and attenuates podocyte injury.
(A) Western blot analysis demonstrates an improvement of autophagy level and podocin expression in the glomeruli isolated from mice as indicated. The glomerular lysates (made from the pool of kidneys from six animals/group) were separated on a SDS-polyacrylamide gel and immunoblotted with a specific monoclonal antibody against LC3, podocin and α-tubulin, respectively. Samples from two individual animals were used at each timepoint. (B) Quantitative determination of LC3 and podocin protein abundance after normalization with α-tubulin. Data are presented as means ± SEM of three experiments. n = 6, *P<0.05 vs. normal control. #P<0.05 vs. diabetic group. (C–K) Immunofluorescence staining shows the changes of autophagosomes in various groups (400× magnification). Kidney section were immunostained with anti-LC3 antibody (green) to identify autophagosomes, followed by staining with anti-podocin antibody (red) to sever as a marker for podocytes. The left column (C, F and I): control group; The second column (D, G and J): diabetic group; The third column (E, H and K): diabetic group treated with 500 mg/kg/day TUDCA.

Similar articles

Cited by

References

    1. Pavenstadt H, Kriz W, Kretzler M (2003) Cell biology of the glomerular podocyte. Physiol Rev 83: 253–307. - PubMed
    1. Wolf G, Chen S, Ziyadeh FN (2005) From the periphery of the glomerular capillary wall toward the center of disease: podocyte injury comes of age in diabetic nephropathy. Diabetes 54: 1626–1634. - PubMed
    1. Quaggin SE (2002) Transcriptional regulation of podocyte specification and differentiation. Microsc Res Tech 57: 208–211. - PubMed
    1. Kobayashi N (2002) Mechanism of the process formation; podocytes vs. neurons. Microsc Res Tech 57: 217–223. - PubMed
    1. Klionsky DJ, Emr SD (2000) Autophagy as a regulated pathway of cellular degradation. Science 290: 1717–1721. - PMC - PubMed

Publication types

MeSH terms