

Pharmacometabolomic approach to predict QT prolongation in guinea pigs
- PMID: 23593245
- PMCID: PMC3617128
- DOI: 10.1371/journal.pone.0060556
Pharmacometabolomic approach to predict QT prolongation in guinea pigs
Abstract
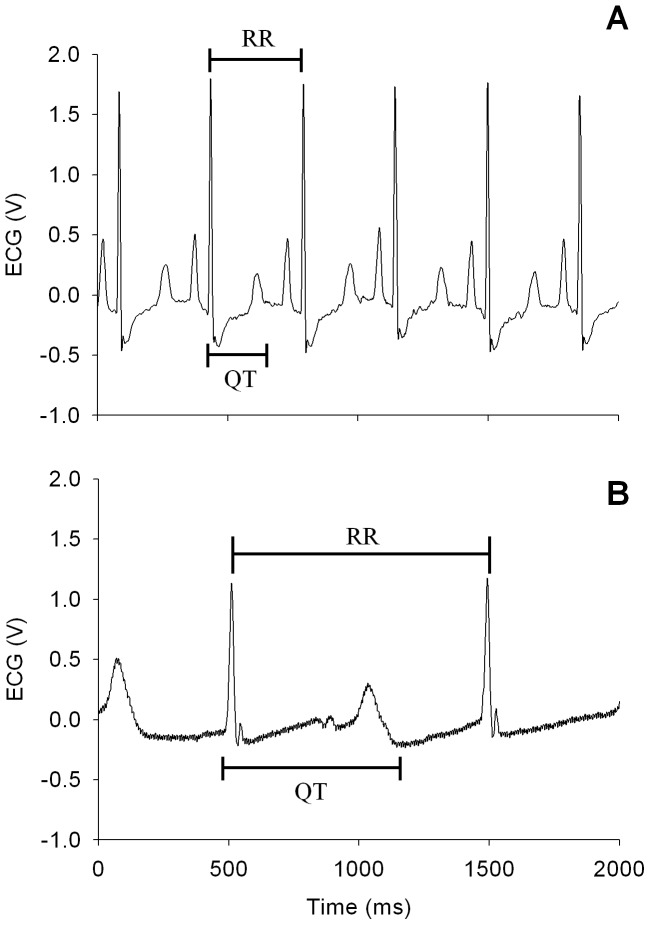
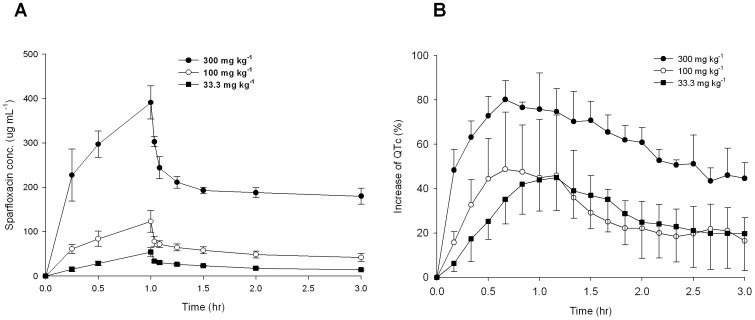
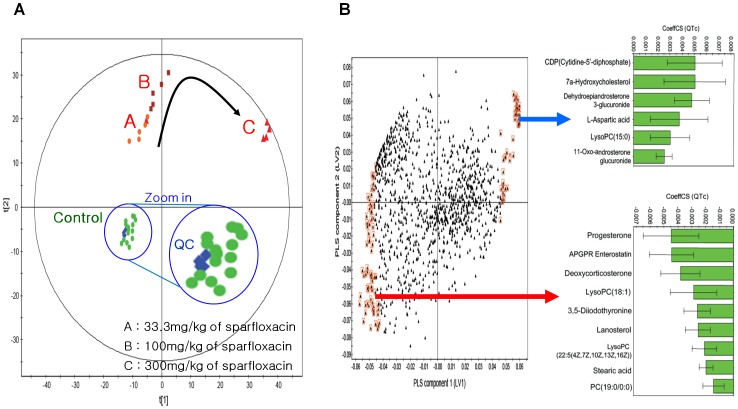
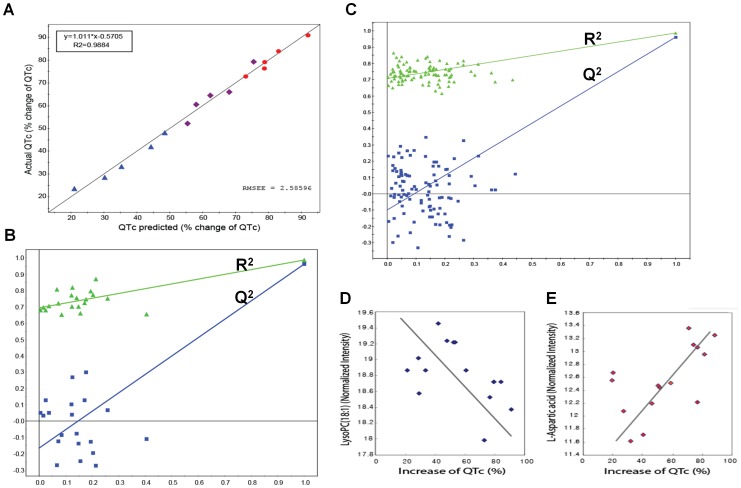
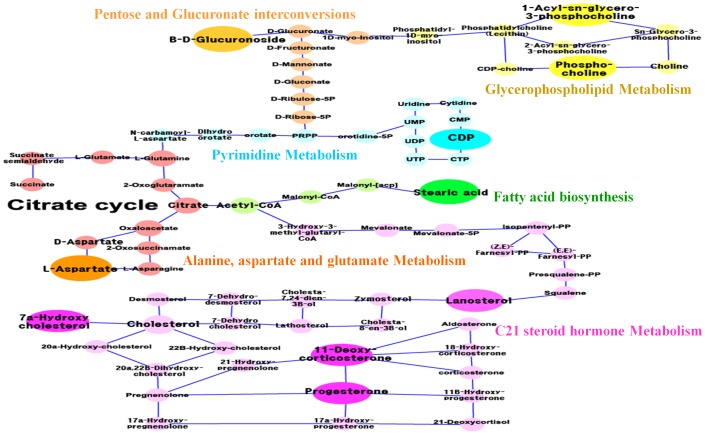
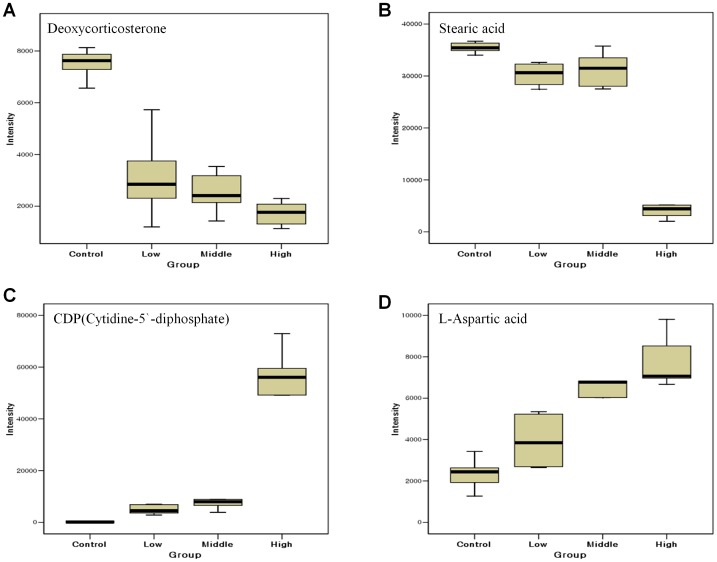
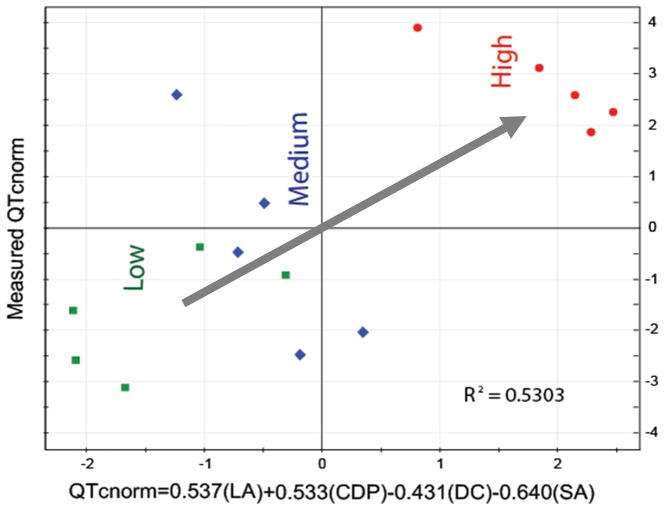
Drug-induced torsades de pointes (TdP), a life-threatening arrhythmia associated with prolongation of the QT interval, has been a significant reason for withdrawal of several medicines from the market. Prolongation of the QT interval is considered as the best biomarker for predicting the torsadogenic risk of a new chemical entity. Because of the difficulty assessing the risk for TdP during drug development, we evaluated the metabolic phenotype for predicting QT prolongation induced by sparfloxacin, and elucidated the metabolic pathway related to the QT prolongation. We performed electrocardiography analysis and liquid chromatography-mass spectroscopy-based metabolic profiling of plasma samples obtained from 15 guinea pigs after administration of sparfloxacin at doses of 33.3, 100, and 300 mg/kg. Principal component analysis and partial least squares modelling were conducted to select the metabolites that substantially contributed to the prediction of QT prolongation. QTc increased significantly with increasing dose (r = 0.93). From the PLS analysis, the key metabolites that showed the highest variable importance in the projection values (>1.5) were selected, identified, and used to determine the metabolic network. In particular, cytidine-5'-diphosphate (CDP), deoxycorticosterone, L-aspartic acid and stearic acid were found to be final metabolomic phenotypes for the prediction of QT prolongation. Metabolomic phenotypes for predicting drug-induced QT prolongation of sparfloxacin were developed and can be applied to cardiac toxicity screening of other drugs. In addition, this integrative pharmacometabolomic approach would serve as a good tool for predicting pharmacodynamic or toxicological effects caused by changes in dose.
Conflict of interest statement
Figures
Similar articles
-
Relationships between preclinical cardiac electrophysiology, clinical QT interval prolongation and torsade de pointes for a broad range of drugs: evidence for a provisional safety margin in drug development.Cardiovasc Res. 2003 Apr 1;58(1):32-45. doi: 10.1016/s0008-6363(02)00846-5. Cardiovasc Res. 2003. PMID: 12667944 Review.
-
A new biomarker--index of cardiac electrophysiological balance (iCEB)--plays an important role in drug-induced cardiac arrhythmias: beyond QT-prolongation and Torsades de Pointes (TdPs).J Pharmacol Toxicol Methods. 2013 Sep-Oct;68(2):250-259. doi: 10.1016/j.vascn.2013.01.003. Epub 2013 Jan 19. J Pharmacol Toxicol Methods. 2013. PMID: 23337247
-
QT prolongation in anaesthetized guinea-pigs: an experimental approach for preliminary screening of torsadogenicity of drugs and drug candidates.J Appl Toxicol. 2004 May-Jun;24(3):217-22. doi: 10.1002/jat.975. J Appl Toxicol. 2004. PMID: 15211616
-
QT interval prolongation and the risk of torsades de pointes: essentials for clinicians.Curr Med Res Opin. 2013 Dec;29(12):1719-26. doi: 10.1185/03007995.2013.840568. Epub 2013 Sep 23. Curr Med Res Opin. 2013. PMID: 24020938 Review.
-
Nonclinical proarrhythmia models: predicting Torsades de Pointes.J Pharmacol Toxicol Methods. 2005 Jul-Aug;52(1):46-59. doi: 10.1016/j.vascn.2005.04.011. J Pharmacol Toxicol Methods. 2005. PMID: 15975832 Review.
Cited by
-
Metabolomic patterns associated to QTc interval in shiftworkers: an explorative analysis.Biomarkers. 2016 Nov;21(7):607-13. doi: 10.3109/1354750X.2016.1171900. Epub 2016 Apr 28. Biomarkers. 2016. PMID: 27121294 Free PMC article.
-
From Metabonomics to Pharmacometabonomics: The Role of Metabolic Profiling in Personalized Medicine.Front Pharmacol. 2016 Sep 8;7:297. doi: 10.3389/fphar.2016.00297. eCollection 2016. Front Pharmacol. 2016. PMID: 27660611 Free PMC article. Review.
-
Association of N-Acetyl Asparagine with QTc in Diabetes: A Metabolomics Study.Biomedicines. 2022 Aug 12;10(8):1955. doi: 10.3390/biomedicines10081955. Biomedicines. 2022. PMID: 36009502 Free PMC article.
-
Pharmacokinetics in Pharmacometabolomics: Towards Personalized Medication.Pharmaceuticals (Basel). 2023 Nov 7;16(11):1568. doi: 10.3390/ph16111568. Pharmaceuticals (Basel). 2023. PMID: 38004434 Free PMC article. Review.
References
-
- Beringer PM, Wong-Beringer A, Rho JP (1998) Economic aspects of antibacterial adverse effects. Pharmacoeconomics 13: 35–49. - PubMed
-
- De Sarro A, De Sarro G (2001) Adverse reactions to fluoroquinolones. An overview on mechanistic aspects. Curr Med Chem 8: 371–384. - PubMed
-
- Haverkamp W, Breithardt G, Camm AJ, Janse MJ, Rosen MR, et al. (2000) The potential for QT prolongation and pro-arrhythmia by non-anti-arrhythmic drugs: clinical and regulatory implications. Report on a Policy Conference of the European Society of Cardiology. Cardiovasc Res 47: 219–233. - PubMed
-
- Owens RC, Ambrose PG (2005) Antimicrobial safety: focus on fluoroquinolones. Clin Infect Dis 41: 144–157. - PubMed
-
- Rubinstein E (2001) History of quinolones and their side effects. Chemotherapy 47: 44–48. - PubMed
Publication types
MeSH terms
Substances
LinkOut - more resources
Full Text Sources
Other Literature Sources
