

Impacts of intensive logging on the trophic organisation of ant communities in a biodiversity hotspot
- PMID: 23593302
- PMCID: PMC3622666
- DOI: 10.1371/journal.pone.0060756
Impacts of intensive logging on the trophic organisation of ant communities in a biodiversity hotspot
Abstract
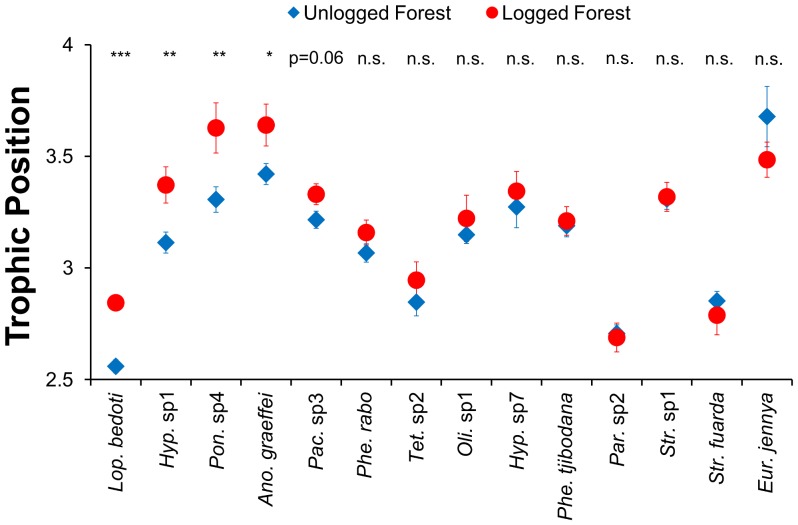
Trophic organisation defines the flow of energy through ecosystems and is a key component of community structure. Widespread and intensifying anthropogenic disturbance threatens to disrupt trophic organisation by altering species composition and relative abundances and by driving shifts in the trophic ecology of species that persist in disturbed ecosystems. We examined how intensive disturbance caused by selective logging affects trophic organisation in the biodiversity hotspot of Sabah, Borneo. Using stable nitrogen isotopes, we quantified the positions in the food web of 159 leaf-litter ant species in unlogged and logged rainforest and tested four predictions: (i) there is a negative relationship between the trophic position of a species in unlogged forest and its change in abundance following logging, (ii) the trophic positions of species are altered by logging, (iii) disturbance alters the frequency distribution of trophic positions within the ant assemblage, and (iv) disturbance reduces food chain length. We found that ant abundance was 30% lower in logged forest than in unlogged forest but changes in abundance of individual species were not related to trophic position, providing no support for prediction (i). However, trophic positions of individual species were significantly higher in logged forest, supporting prediction (ii). Consequently, the frequency distribution of trophic positions differed significantly between unlogged and logged forest, supporting prediction (iii), and food chains were 0.2 trophic levels longer in logged forest, the opposite of prediction (iv). Our results demonstrate that disturbance can alter trophic organisation even without trophically-biased changes in community composition. Nonetheless, the absence of any reduction in food chain length in logged forest suggests that species-rich arthropod food webs do not experience trophic downgrading or a related collapse in trophic organisation despite the disturbance caused by logging. These food webs appear able to bend without breaking in the face of some forms of anthropogenic disturbance.
Conflict of interest statement
Figures


Similar articles
-
Reduced-impact logging and biodiversity conservation: a case study from Borneo.Ecol Appl. 2012 Mar;22(2):561-71. doi: 10.1890/11-1362.1. Ecol Appl. 2012. PMID: 22611854
-
Selective‐logging and oil palm: multitaxon impacts, biodiversity indicators, and trade‐offs for conservation planning.Ecol Appl. 2014;24(8):2029-49. Ecol Appl. 2014. PMID: 29185670
-
The conservation value of South East Asia's highly degraded forests: evidence from leaf-litter ants.Philos Trans R Soc Lond B Biol Sci. 2011 Nov 27;366(1582):3256-64. doi: 10.1098/rstb.2011.0031. Philos Trans R Soc Lond B Biol Sci. 2011. PMID: 22006966 Free PMC article.
-
Bird species and traits associated with logged and unlogged forest in Borneo.Ecol Appl. 2007 Jun;17(4):1184-97. doi: 10.1890/05-0878. Ecol Appl. 2007. PMID: 17555227
-
Trophic flexibility and the persistence of understory birds in intensively logged rainforest.Conserv Biol. 2013 Oct;27(5):1079-86. doi: 10.1111/cobi.12059. Epub 2013 May 6. Conserv Biol. 2013. PMID: 23647024
Cited by
-
Land use not litter quality is a stronger driver of decomposition in hyperdiverse tropical forest.Ecol Evol. 2017 Oct 4;7(22):9307-9318. doi: 10.1002/ece3.3460. eCollection 2017 Nov. Ecol Evol. 2017. PMID: 29187970 Free PMC article.
-
Multiple stages of tree seedling recruitment are altered in tropical forests degraded by selective logging.Ecol Evol. 2018 Jul 22;8(16):8231-8242. doi: 10.1002/ece3.4352. eCollection 2018 Aug. Ecol Evol. 2018. PMID: 30250698 Free PMC article.
-
The Gut Bacterial Community of Chlaenius pallipes (Coleoptera: Carabidae) Associates with Their Habitat and Morphology.Insects. 2022 Nov 29;13(12):1099. doi: 10.3390/insects13121099. Insects. 2022. PMID: 36555009 Free PMC article.
-
The impact of selective-logging and forest clearance for oil palm on fungal communities in Borneo.PLoS One. 2014 Nov 18;9(11):e111525. doi: 10.1371/journal.pone.0111525. eCollection 2014. PLoS One. 2014. PMID: 25405609 Free PMC article.
-
Trophic position determines the persistence of neotropical understory birds after forest disturbance.Ecol Evol. 2024 May 6;14(5):e11370. doi: 10.1002/ece3.11370. eCollection 2024 May. Ecol Evol. 2024. PMID: 38716169 Free PMC article.
References
-
- Duffy JE, Cardinale BJ, France KE, McIntyre PB, Thebault E, et al. (2007) The functional role of biodiversity in ecosystems: incorporating trophic complexity. Ecol Lett 10: 522–538. - PubMed
-
- Rooney N, McCann KS, Moore JC (2008) A landscape theory for food web architecture. Ecol Lett 11: 867–881. - PubMed
-
- Schindler DE, Carpenter SR, Cole JJ, Kitchell JF, Pace ML (1997) Influence of food web structure on carbon exchange between lakes and the atmosphere. Science 277: 248–251.
-
- Terborgh J, Lopez L, Nunez P, Rao M, Shahabuddin G, et al. (2001) Ecological meltdown in predator-free forest fragments. Science 294: 1923–1926. - PubMed
-
- Balvanera P, Pfisterer AB, Buchmann N, He J-S, Nakashizuka T, et al. (2006) Quantifying the evidence for biodiversity effects on ecosystem functioning and services. Ecol Lett 9: 1146–1156. - PubMed
Publication types
MeSH terms
LinkOut - more resources
Full Text Sources
Other Literature Sources
