

Mutations in ap1b1 cause mistargeting of the Na(+)/K(+)-ATPase pump in sensory hair cells
- PMID: 23593334
- PMCID: PMC3625210
- DOI: 10.1371/journal.pone.0060866
Mutations in ap1b1 cause mistargeting of the Na(+)/K(+)-ATPase pump in sensory hair cells
Abstract
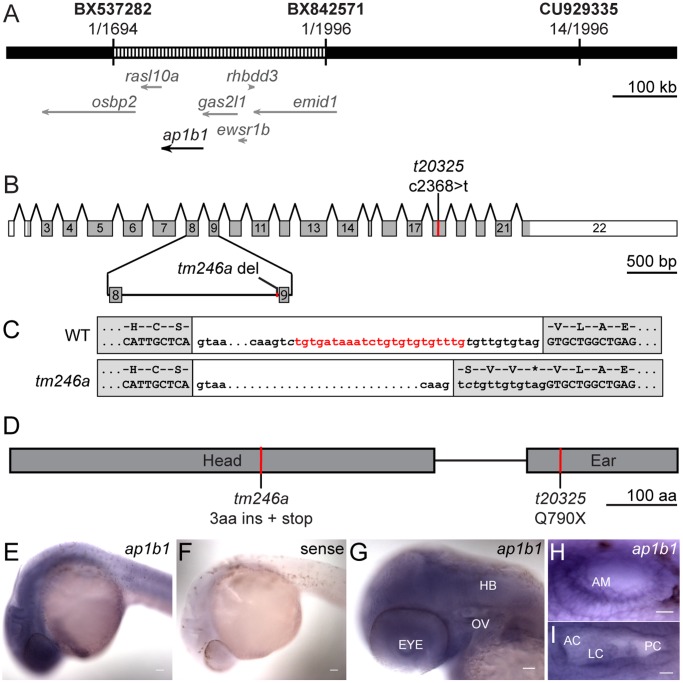
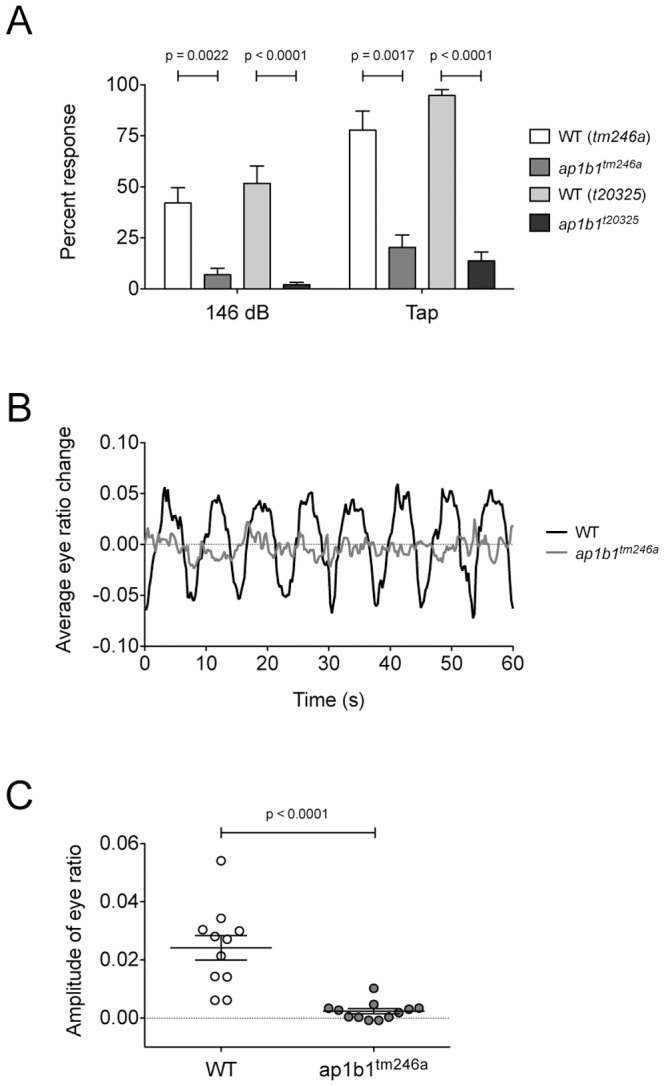
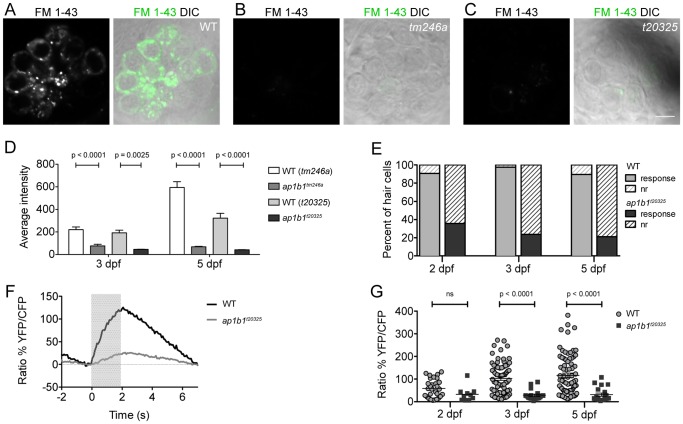
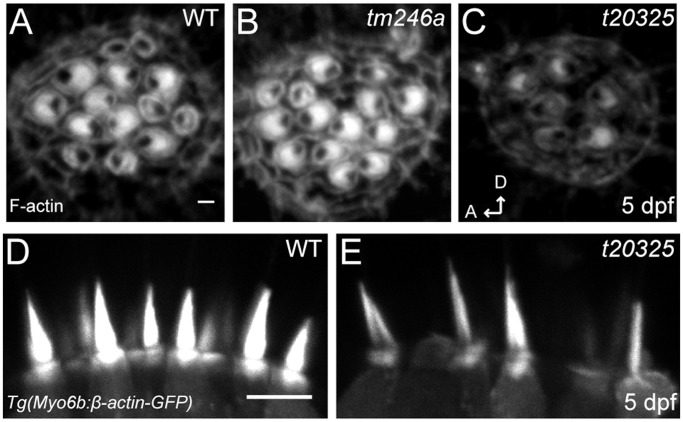
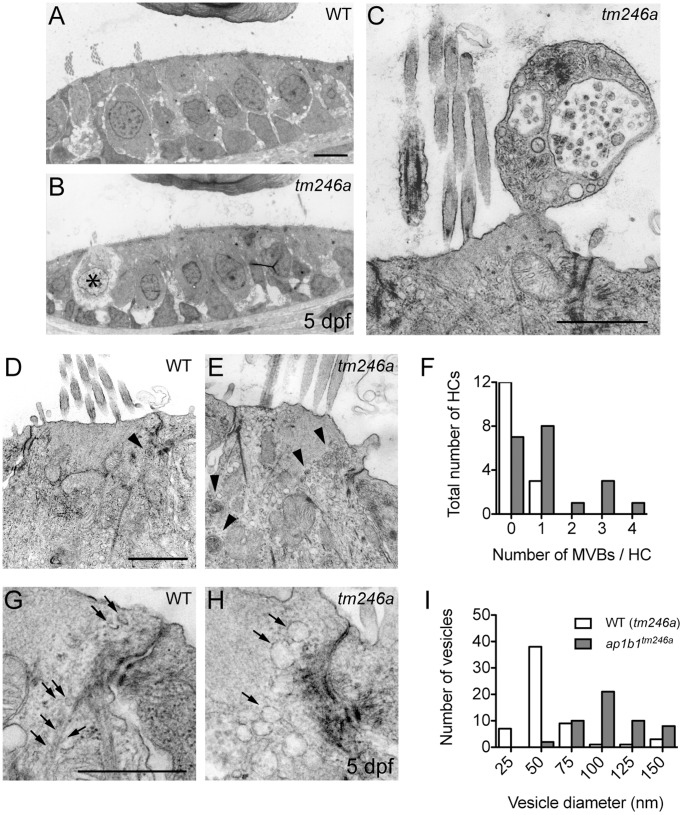
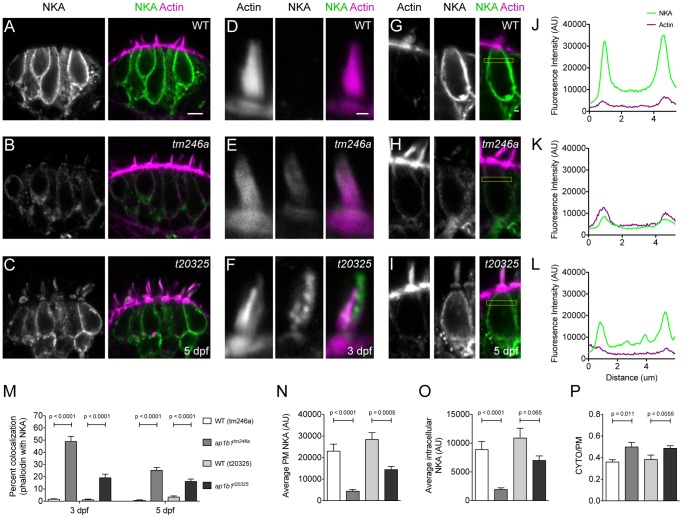
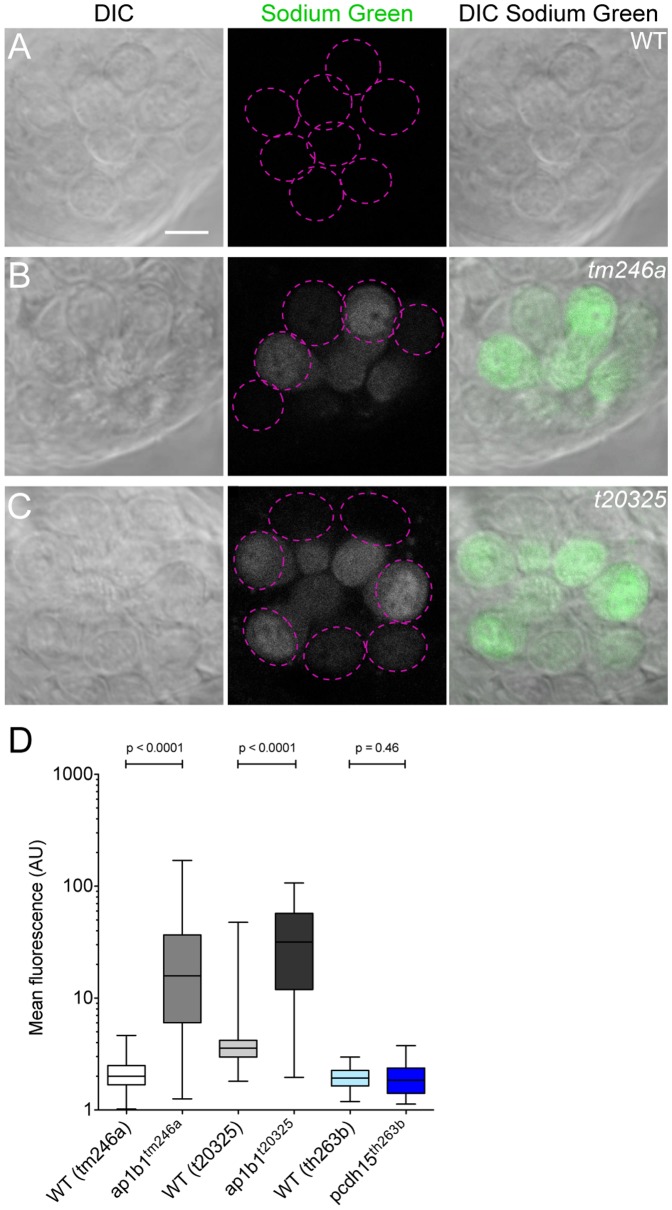
The hair cells of the inner ear are polarized epithelial cells with a specialized structure at the apical surface, the mechanosensitive hair bundle. Mechanotransduction occurs within the hair bundle, whereas synaptic transmission takes place at the basolateral membrane. The molecular basis of the development and maintenance of the apical and basal compartments in sensory hair cells is poorly understood. Here we describe auditory/vestibular mutants isolated from forward genetic screens in zebrafish with lesions in the adaptor protein 1 beta subunit 1 (ap1b1) gene. Ap1b1 is a subunit of the adaptor complex AP-1, which has been implicated in the targeting of basolateral membrane proteins. In ap1b1 mutants we observed that although the overall development of the inner ear and lateral-line organ appeared normal, the sensory epithelium showed progressive signs of degeneration. Mechanically-evoked calcium transients were reduced in mutant hair cells, indicating that mechanotransduction was also compromised. To gain insight into the cellular and molecular defects in ap1b1 mutants, we examined the localization of basolateral membrane proteins in hair cells. We observed that the Na(+)/K(+)-ATPase pump (NKA) was less abundant in the basolateral membrane and was mislocalized to apical bundles in ap1b1 mutant hair cells. Accordingly, intracellular Na(+) levels were increased in ap1b1 mutant hair cells. Our results suggest that Ap1b1 is essential for maintaining integrity and ion homeostasis in hair cells.
Conflict of interest statement
Figures
Similar articles
-
The genetics of hair-cell function in zebrafish.J Neurogenet. 2017 Sep;31(3):102-112. doi: 10.1080/01677063.2017.1342246. Epub 2017 Jul 13. J Neurogenet. 2017. PMID: 28705044 Free PMC article. Review.
-
Zebrafish Models for the Mechanosensory Hair Cell Dysfunction in Usher Syndrome 3 Reveal That Clarin-1 Is an Essential Hair Bundle Protein.J Neurosci. 2015 Jul 15;35(28):10188-201. doi: 10.1523/JNEUROSCI.1096-15.2015. J Neurosci. 2015. PMID: 26180195 Free PMC article.
-
Mutations in cadherin 23 affect tip links in zebrafish sensory hair cells.Nature. 2004 Apr 29;428(6986):955-9. doi: 10.1038/nature02484. Epub 2004 Mar 31. Nature. 2004. PMID: 15057246
-
Myosin VI is required for structural integrity of the apical surface of sensory hair cells in zebrafish.Dev Biol. 2004 Aug 15;272(2):328-38. doi: 10.1016/j.ydbio.2004.05.004. Dev Biol. 2004. PMID: 15282151
-
Auditory and vestibular hair cell stereocilia: relationship between functionality and inner ear disease.J Laryngol Otol. 2011 Oct;125(10):991-1003. doi: 10.1017/S0022215111001459. Epub 2011 Jul 21. J Laryngol Otol. 2011. PMID: 21774850 Review.
Cited by
-
A hypomorphic mutation of the gamma-1 adaptin gene (Ap1g1) causes inner ear, retina, thyroid, and testes abnormalities in mice.Mamm Genome. 2016 Jun;27(5-6):200-12. doi: 10.1007/s00335-016-9632-0. Epub 2016 Apr 18. Mamm Genome. 2016. PMID: 27090238 Free PMC article.
-
Subunits of the mechano-electrical transduction channel, Tmc1/2b, require Tmie to localize in zebrafish sensory hair cells.PLoS Genet. 2019 Feb 6;15(2):e1007635. doi: 10.1371/journal.pgen.1007635. eCollection 2019 Feb. PLoS Genet. 2019. PMID: 30726219 Free PMC article.
-
Disruption of Glutamate Release and Uptake-Related Protein Expression After Noise-Induced Synaptopathy in the Cochlea.Front Cell Dev Biol. 2021 Aug 4;9:720902. doi: 10.3389/fcell.2021.720902. eCollection 2021. Front Cell Dev Biol. 2021. PMID: 34422838 Free PMC article.
-
The genetics of hair-cell function in zebrafish.J Neurogenet. 2017 Sep;31(3):102-112. doi: 10.1080/01677063.2017.1342246. Epub 2017 Jul 13. J Neurogenet. 2017. PMID: 28705044 Free PMC article. Review.
-
Water Waves to Sound Waves: Using Zebrafish to Explore Hair Cell Biology.J Assoc Res Otolaryngol. 2019 Feb;20(1):1-19. doi: 10.1007/s10162-018-00711-1. Epub 2019 Jan 11. J Assoc Res Otolaryngol. 2019. PMID: 30635804 Free PMC article. Review.
References
-
- Dambly-Chaudière C, Sapède D, Soubiran F, Decorde K, Gompel N, et al. (2003) The lateral line of zebrafish: a model system for the analysis of morphogenesis and neural development in vertebrates. Biol Cell 95: 579–87. - PubMed
-
- Metcalfe WK, Kimmel CB, Schabtach E (1985) Anatomy of the posterior lateral line system in young larvae of the zebrafish. J Comp Neurol 233: 377–89. - PubMed
-
- Anniko M, Wróblewski R (1986) Ionic environment of cochlear hair cells. Hear Res 22: 279–93. - PubMed
Publication types
MeSH terms
Substances
Grants and funding
LinkOut - more resources
Full Text Sources
Other Literature Sources
Molecular Biology Databases
Research Materials
Miscellaneous
