. 2013 Apr 12;8(4):e60932.
doi: 10.1371/journal.pone.0060932. Print 2013.

Expression of regulatory platelet microRNAs in patients with sickle cell disease

Affiliations

Expression of regulatory platelet microRNAs in patients with sickle cell disease

Shilpa Jain et al. PLoS One. .

Abstract

Background: Increased platelet activation in sickle cell disease (SCD) contributes to a state of hypercoagulability and confers a risk of thromboembolic complications. The role for post-transcriptional regulation of the platelet transcriptome by microRNAs (miRNAs) in SCD has not been previously explored. This is the first study to determine whether platelets from SCD exhibit an altered miRNA expression profile.

Methods and findings: We analyzed the expression of miRNAs isolated from platelets from a primary cohort (SCD = 19, controls = 10) and a validation cohort (SCD = 7, controls = 7) by hybridizing to the Agilent miRNA microarrays. A dramatic difference in miRNA expression profiles between patients and controls was noted in both cohorts separately. A total of 40 differentially expressed platelet miRNAs were identified as common in both cohorts (p-value 0.05, fold change>2) with 24 miRNAs downregulated. Interestingly, 14 of the 24 downregulated miRNAs were members of three families - miR-329, miR-376 and miR-154 - which localized to the epigenetically regulated, maternally imprinted chromosome 14q32 region. We validated the downregulated miRNAs, miR-376a and miR-409-3p, and an upregulated miR-1225-3p using qRT-PCR. Over-expression of the miR-1225-3p in the Meg01 cells was followed by mRNA expression profiling to identify mRNA targets. This resulted in significant transcriptional repression of 1605 transcripts. A combinatorial approach using Meg01 mRNA expression profiles following miR-1225-3p overexpression, a computational prediction analysis of miRNA target sequences and a previously published set of differentially expressed platelet transcripts from SCD patients, identified three novel platelet mRNA targets: PBXIP1, PLAGL2 and PHF20L1.

Conclusions: We have identified significant differences in functionally active platelet miRNAs in patients with SCD as compared to controls. These data provide an important inventory of differentially expressed miRNAs in SCD patients and an experimental framework for future studies of miRNAs as regulators of biological pathways in platelets.


Conflict of interest statement

Competing Interests: The authors have declared that no competing interests exist.

Figures

Figure 1
Figure 1. MiRNAs in platelets of SCD patients are differentially expressed.
(A) Characterization of purified platelet preparation by flow cytometry. (B) Bioanalyzer assessment of RNA samples from purified platelet preps showing good quality with RIN of 7.8. (C) Venn diagram comparing differentially expressed miRNAs from two independent study cohorts. Comparison of 259 differentially expressed miRNAs from NHLBI samples and 67 differentially expressed miRNAs from UPMC samples. In total, there are 40 miRNAs overlapping between the two cohorts. (D) The heatmap depicts the 40 statistically significant (p-value<0.05, FC>2) differentially expressed miRNAs between SCD and controls that were common between the two cohorts. Columns represent individual samples and each represents a miRNA. Upregulated miRNAs expression levels are shown in progressively brighter shades of yellow, depending on the fold difference. Downregulated miRNAs are shown in progressively brighter shades of purple. No difference is represented as grey. The names of the miRNAs are displayed to the right of the heatmap.
Figure 2
Figure 2. Most significant predicted canonical pathways regulated by the target genes of the 3 miRNAs: 376a, 409-3p and 1225-3p (p-value<0.01).
Orange squares depict ratio which is the number of target genes associated with each pathway. The vertical line across the bars represents the cut-off of the p-value.
Figure 3
Figure 3. miR-376a and miR-409-3p are downregulated and miR-1225-3p is upregulated in SCD platelets.
qRT-PCR validation of the microarray data. For each miRNA the blue bar represents controls (n = 26) and the red bar represents SCD (n = 17). Y-axis shows fold change of miRNAs in SCD samples with the expression level in controls set to 1. Error Bars represent standard deviation.
Figure 4
Figure 4. miR-1225-3p regulates gene expression after transfection in MEG-01 cells.
(A) Expression of the flourescent marker pmaxGFP plasmid as determined by flow cytometry demonstrates 76% GFP expressing cells out of the viable cell population. (B) qRT-PCR assay confirms overexpression of miR-1225-3p in MEG-01 cells (n = 5) vs scrambled (scr) (n = 5). (C) MT1X, PTPN6, IFI6, FCER1G and RAP2A are significantly downregulated in MEG-01 transfected cells as validated by qRT-PCR. (D) Schematic representation of overlap in differentially expressed genes between miR-1225-3p transfected MEG-01 cells and platelets from SCD patients. The numbers in the circles denote the differentially expressed genes with the leftmost figure representing genes using a FDR of 5% and the rightmost figure after applying a stringent statistical filter of FC>2. Further overlap with ComiR predicted target list of the 40 differentially expressed miRNAs resulted in a list of 7 genes potentially regulated by miR-1225-3p. (E) Out of the 7 genes, PLAGL2 and PBXIP1 genes are significantly downregulated and PHF20L1 is significantly upregulated in miR-1225-3p transfected cells vs scrambled. In the qRT-PCR figures (B, C and D), for each gene, the blue bar represents the cells transfected with scrambled RNA (n = 5) and the red bar represents the miR-1225-3p transfected cells (n = 5). Y-axis shows fold change of miR-1225-3p in transfected cells with the expression level in scrambled set to 1. Error bars are based on standard deviation. *denotes p-value<0.05.
Figure 5
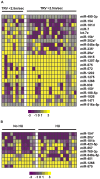
Figure 5. miRNAs in platelets have a unique expression profile in SCD patients based on Doppler-estimated TRV and HU treatment.
(A) The heatmap represents 23 statistically significant (p-value<0.1, FC>2) differentially expressed miRNAs between subjects with (N = 18) and without (N = 8) elevated TRV (>2.5 m/sec). (B) The heatmap represents 10 statistically significant (p-value<0.1, FC>2) differentially expressed miRNAs between the subjects on (N = 14) and off HU (N = 12). Every row represents a gene and every column is a patient. Upregulated miRNAs are shown in yellow color, downregulated miRNAs are shown in purple and no difference is grey. The names of the miRNAs are displayed to the right of heatmap.

References

    1. Blann AD, Marwah S, Serjeant G, Bareford D, Wright J (2003) Platelet activation and endothelial cell dysfunction in sickle cell disease is unrelated to reduced antioxidant capacity. Blood Coagul Fibrinolysis 14: 255–259. - PubMed
    1. Villagra J, Shiva S, Hunter LA, Machado RF, Gladwin MT, et al. (2007) Platelet activation in patients with sickle disease, hemolysis-associated pulmonary hypertension, and nitric oxide scavenging by cell-free hemoglobin. Blood 110: 2166–2172. - PMC - PubMed
    1. Wun T, Paglieroni T, Rangaswami A, Franklin PH, Welborn J, et al. (1998) Platelet activation in patients with sickle cell disease. Br J Haematol 100: 741–749. - PubMed
    1. Tomer A, Harker LA, Kasey S, Eckman JR (2001) Thrombogenesis in sickle cell disease. J Lab Clin Med 137: 398–407. - PubMed
    1. Mohan JS, Lip GY, Bareford D, Blann AD (2006) Platelet P-selectin and platelet mass, volume and component in sickle cell disease: relationship to genotype. Thromb Res 117: 623–629. - PubMed

Publication types

MeSH terms