. 2013 Apr 12;8(4):e60935.
doi: 10.1371/journal.pone.0060935. Print 2013.

Evolutionary paths of the cAMP-dependent protein kinase (PKA) catalytic subunits

Affiliations

Evolutionary paths of the cAMP-dependent protein kinase (PKA) catalytic subunits

Kristoffer Søberg et al. PLoS One. .

Abstract

3',5'-cyclic adenosine monophosphate (cAMP) dependent protein kinase or protein kinase A (PKA) has served as a prototype for the large family of protein kinases that are crucially important for signal transduction in eukaryotic cells. The PKA catalytic subunits Cα and Cβ, encoded by the two genes PRKACA and PRKACB, respectively, are among the best understood and characterized human kinases. Here we have studied the evolution of this gene family in chordates, arthropods, mollusks and other animals employing probabilistic methods and show that Cα and Cβ arose by duplication of an ancestral PKA catalytic subunit in a common ancestor of vertebrates. The two genes have subsequently been duplicated in teleost fishes. The evolution of the PRKACG retroposon in simians was also investigated. Although the degree of sequence conservation in the PKA Cα/Cβ kinase family is exceptionally high, a small set of signature residues defining Cα and Cβ subfamilies were identified. These conserved residues might be important for functions that are unique to the Cα or Cβ clades. This study also provides a good example of a seemingly simple phylogenetic problem which, due to a very high degree of sequence conservation and corresponding weak phylogenetic signals, combined with problematic nonphylogenetic signals, is nontrivial for state-of-the-art probabilistic phylogenetic methods.


Conflict of interest statement

Competing Interests: The authors have declared that no competing interests exist.

Figures

Figure 1
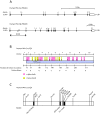
Figure 1. Gene structure and overview of the human PKA catalytic subunits Cα and Cβ encoded by the PRKACA and PRKACB genes, respectively.
A Exons, introns and 3′ and 5′ untranslated regions (UTRs) of the PKA catalytic subunit genes are shown. The human Cα gene (PRKACA) is located at chromosome 19p13.1 (reverse strand) and has a length of approximately 26 000 nucleotides (nt). Alternative transcription start sites give rise to two splice variants known as Cα1 and Cα2 (formerly known as CαS). Both splice variants comprise exons 2 to 10 and in addition a 5′ exon 1–1 or 1–2 in Cα1 and Cα2, respectively. The human Cβ gene (PRKACB) is located at chromosome 1p31.1 (forward strand), with a length of approximately 160 000 nt. Alternative splicing of exons 1–1, 1–2, 1–3 and 1–4 give rise to the splice variants Cβ1, Cβ2, Cβ3 and Cβ4, respectively. In addition, three short exons, a, b and c, have been shown to be included in the transcript in various combinations. All known enzymatically active isoforms of Cβ comprise exons 2 to 10. B Human PKA Cα1 consists of ten α-helix and nine β-strand secondary structure elements . The figure (middle box) gives the location of α-helices (pink, A–J) and β-strands (yellow, 1–9) relative to the ten exons and 351 encoded codons of the Cα1 isoform. The locations of the boundaries between exons are given on the upper line. The codons corresponding to the nine introns, as well as their intron phases, are given on the lower line. The intron phase is defined as the position of the intron within a codon, with phase 0, 1, or 2 lying before the first base, after the first base, or after the second base, respectively. Human PKA Cβ1 has the same length as Cα1, and the two proteins are differing at only 25 amino acid positions (92.9% sequence identity), strongly suggesting that the overall 3D structures, including secondary structure elements, are close to identical. The position and intron phases for the nine introns are also conserved between human Cα1 and Cβ1. The sequence segment corresponding to exons 2–10, termed Core16–350, is shown as a blue bar. C The function of selected important residues and motifs in human PKA catalytic subunits has previously been elucidated in the literature. All listed residues, and their numbering, are identical in Cα1 and Cβ1, but the research describing these residues and motifs has mainly been performed on Cα. Numbering of amino acids is given for mature Cα1 and Cβ1 (with N-terminal Met removed), both encoding 350 residues. Gly1 is found to be posttranslationally modified by myristoylation . Ser10, Ser139 and Ser338 are well characterized phosphorylation sites , . The Gly-rich loop (Gly50–Gly55) plays an important role in phosphoryl transfer –. Lys72 and Asp184 are crucial for ATP and Mg2+ binding in the active site and the DFG motif (Asp184–Gly186) is conserved in most kinases. The conformation of the motif is critical for the functional state of the kinase , . Phe327 is the only residue outside of the kinase core binding to the adenine of ATP . Trp196 is an essential residue for R subunit binding and phosphorylation of Thr197 is necessary for the enzyme to assume the active conformation, thereby facilitating catalysis as well as R subunit binding , . The hydrophobic P+1 motif (Gly200–Glu208) is important for the structure of the enzyme, as well as for substrate recognition , . Tyr247 competes with cAMP for R subunit binding .
Figure 2
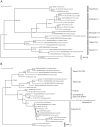
Figure 2. Phylogenetic relationships among the PKA catalytic subunit homologs in chordates.
The Cα and Cβ paralogs are a result of a gene duplication in a common ancestor of vertebrates. Subsequent duplications of Cα and Cβ in a teleost fish ancestor have resulted in four PKA catalytic subunits in these organisms. The Bayesian inference tree is based on the nucleotide sequences (codon positions 1 and 2 only, GTR+Γ+I model) of exons 2 to 10 which corresponds to a multiple sequence alignment with no gaps. The phylogram is shown with estimated branch lengths proportional to the number of substitutions at each site, as indicated by the scale bar. The arthropod fruit fly (D. melanogaster) and the echinoderm sea urchin (S. purpuratus) have been set as outgroups. Bayesian posterior probabilities are shown for each node. The topology of a maximum likelihood (ML) tree generated with the same data set and model was identical to the Bayesian inference tree. ML bootstrap values are shown for selected nodes (1000 replications). The sequences of human and mouse PKA Cα and Cβ and the homologs from amphioxus (B. floridae), zebra finch (T. guttata), chicken (G. gallus), the frog X. tropicalis, the lizard A. carolinensis, medaka (O. latipes), the pufferfish T. rubripes, and stickleback (G. aculeatus) are described in Materials and Methods S1. The X. tropicalis Cα and A. carolinensis Cβ are incorrectly placed (See discussion and Fig. 3).
Figure 3
Figure 3. The Bayesian inference trees for vertebrate PKA Cα and Cβ both closely reflects the evolutionary relationships among these organisms.
A Phylogenetic analysis of Cα orthologs resulted in a tree that was rooted with human and mouse Cβ as outgroups. The tree was based on the nucleotide sequences of exons 2 to 8 (all codon positions, GTR+Γ+I model). B Phylogenetic analysis of Cβ orthologs was performed employing nucleotide sequence data (all codon positions, exons 2 to 10, GTR+Γ+I model). The resulting tree was rooted with human and mouse Cα as outgroups. In both trees, branch lengths are shown as substitutions per site, with scale indicated by the scale bars. Bayesian posterior probabilities are given for each node and ML bootstrap values (1000 replications) are shown for selected nodes where the clades are identical in the Bayesian and ML analysis. In addition to organisms found in Fig. 2, representative sequences from the following species were included: eutherian mammals rhesus macaque (M. mulatta), tarsier (T. syrichta), dog (C. familiaris), horse (E. caballus), pig (S. scrofa), cow (B. taurus), rat (R. norvegicus), and hamster (C. griseus), marsupial mammals wallaby (M. eugenii) and opossum (M. domestica), the frog X. laevis, the pufferfish T. nigroviridis and Atlantic salmon (S. salar). See Materials and Methods S1 for the sequence data.
Figure 4
Figure 4. The identity of eleven amino acids in the protein chain may define the Cα and Cβ branches of PKA catalytic subunits.
Our full set of PKA catalytic subunits (Materials and Methods S1) from bony fishes and tetrapods, comprising 27 Cα and 33 Cβ, was employed to identify eleven amino acid positions that together may be used to classify a PKA catalytic subunit as belonging to one of the two branches. The sequence logos define the PKA Cα and Cβ clades within the Teleostomi, which includes the familiar classes of bony fishes, birds, mammals, reptiles, and amphibians. We find invariable Gln35, Thr37, Glu64, Gly66, His68, Ser109 and Glu334 in Cα and invariable Asp42, Gln67, and Arg319 in Cβ (Cα1/Cβ1 numbering). The residues in the corresponding positions in human Cα1 and Cβ1 are also shown.
Figure 5
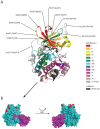
Figure 5. Signature residues defining PKA Cα and Cβ do not interact with ATP, peptide inhibitor PKIα or the kinase regulatory subunit.
A The tentative signature residues of PKA Cα and Cβ (Fig. 4) are highlighted in a structural model of PKA Cα1 in complex with a truncated PKIα (residues 6–25). Signature amino acids in human Cα1 and Cβ1 are shown without and within parenthesis, respectively. The conserved kinase core has been divided into subdomains (represented in different colors) as defined by Hanks and Hunter . ATP is rendered as sticks (black) and two divalent cations as black spheres. The model is based on the experimental structure of Thompson et al. (PDB identifier 3FJQ). B Residues in Cα1 (cyan) interacting with regulatory subunit RIα (purple, residues 92–245 of bovine RIα only) are mainly restricted to the large lobe and do not overlap with any of the Cα signature residues (red). The complex is shown with the same orientation of Cα1 as in panel A (left) and rotated 180° (right). The model is based on the experimental structure of Kim et al. (PDB identifier 3FHI).

Similar articles

Cited by

References

    1. Manning G, Whyte DB, Martinez R, Hunter T, Sudarsanam S (2002) The protein kinase complement of the human genome. Science 298: 1912–1934. - PubMed
    1. Skålhegg BS, Taskén K (2000) Specificity in the cAMP/PKA signaling pathway. Differential expression, regulation, and subcellular localization of subunits of PKA. Front Biosci 5: D678–D693. - PubMed
    1. Taylor SS, Yang J, Wu J, Haste NM, Radzio-Andzelm E, et al. (2004) PKA: a portrait of protein kinase dynamics. Biochim Biophys Acta 1697: 259–269. - PubMed
    1. Krebs EG, Beavo JA (1979) Phosphorylation-dephosphorylation of enzymes. Annu Rev Biochem 48: 923–959. - PubMed
    1. Kim C, Xuong NH, Taylor SS (2005) Crystal structure of a complex between the catalytic and regulatory (RIα) subunits of PKA. Science 307: 690–696. - PubMed

Publication types

Substances

LinkOut - more resources