. 2013 Apr 12;8(4):e60975.
doi: 10.1371/journal.pone.0060975. Print 2013.

Zoledronic acid restores doxorubicin chemosensitivity and immunogenic cell death in multidrug-resistant human cancer cells

Affiliations

Zoledronic acid restores doxorubicin chemosensitivity and immunogenic cell death in multidrug-resistant human cancer cells

Chiara Riganti et al. PLoS One. .

Retraction in

Abstract

Durable tumor cell eradication by chemotherapy is challenged by the development of multidrug-resistance (MDR) and the failure to induce immunogenic cell death. The aim of this work was to investigate whether MDR and immunogenic cell death share a common biochemical pathway eventually amenable to therapeutic intervention. We found that mevalonate pathway activity, Ras and RhoA protein isoprenylation, Ras- and RhoA-downstream signalling pathway activities, Hypoxia Inducible Factor-1alpha activation were significantly higher in MDR+ compared with MDR- human cancer cells, leading to increased P-glycoprotein expression, and protection from doxorubicin-induced cytotoxicity and immunogenic cell death. Zoledronic acid, a potent aminobisphosphonate targeting the mevalonate pathway, interrupted Ras- and RhoA-dependent downstream signalling pathways, abrogated the Hypoxia Inducible Factor-1alpha-driven P-glycoprotein expression, and restored doxorubicin-induced cytotoxicity and immunogenic cell death in MDR+ cells. Immunogenic cell death recovery was documented by the ability of dendritic cells to phagocytise MDR+ cells treated with zoledronic acid plus doxorubicin, and to recruit anti-tumor cytotoxic CD8+ T lymphocytes. These data indicate that MDR+ cells have an hyper-active mevalonate pathway which is targetable with zoledronic acid to antagonize their ability to withstand chemotherapy-induced cytotoxicity and escape immunogenic cell death.


Conflict of interest statement

Competing Interests: The authors have declared that no competing interests exist.

Figures

Figure 1
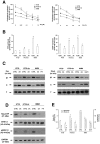
Figure 1. Correlation between intracellular doxorubicin retention, mdr1 expression and Mev pathway activity in MDR− and MDR+ tumor cells.
A. Intracellular doxorubicin (Dox) concentrations in MDR− cells (HT29, A549 and MCF7), in the corresponding acquired MDR+ counterparts (HT29-dx cells, A549-dx cells, MCF7-dx), and constitutive MDR+ cells (HepG2, HP06, HMM). Significantly lower concentrations were detected in cells with acquired MDR vs MDR− cells (HT29-dx vs HT29: *p<0.002; A549-dx vs A549: *p<0.001; MCF7-dx vs MCF7: *p<0.001), and in cells with constitutive MDR vs MDR− cells (mean value of intracellular doxorubicin in HepG2/HP06/HMM vs mean value in HT29/A549/MCF7: °p<0.001). B. mdr1 mRNA expression. Significant higher mdr1 levels were observed in cells with acquired MDR vs MDR− cells (HT29-dx vs HT29: *p<0.002; A549-dx vs A549: *p<0.002; MCF7-dx vs MCF7: *p<0.001), and in cells with constitutive MDR vs MDR− cells (mean value of mdr1 levels in HepG2/HP06/HMM vs mean value in HT29/A549/MCF7: °p<0.001). C. Rate of cholesterol synthesis. Significant higher activity was measured in cells with acquired MDR vs MDR− cells (HT29-dx vs HT29: *p<0.002; A549-dx vs A549: *p<0.002; MCF7-dx vs MCF7: *p<0.002), and in cells with constitutive MDR vs MDR− cells (mean value of cholesterol synthesis in HepG2/HP06/HMM vs mean value in HepG2/HP06/HMM: °p<0.001). D. Direct correlation between the rate of cholesterol synthesis and the expression levels of mdr1 in individual cell lines (r2 = 0.95). For panels A, B, and C bars represent the mean ± SD of 3 independent experiments.
Figure 2
Figure 2. Effects of ZA on cholesterol and isoprenoid synthesis, Ras/RhoA isoprenylation, and ERK1/2 and RhoA kinase activity in MDR− and MDR+ cancer cells.
MDR− HT29, and MDR+ HT29-dx and HMM cells were cultured without (CTRL) or with zoledronic acid (ZA). For panels B–E, ZA (1 µmol/L) was used for 48 h, FTI-277 (10 µmol/L, FTI), GGTI-286 (10 µmol/L, GGTI), Y27632 (10 µmol/L, Y276) for 24 h. A. Left panel: dose-dependent inhibition of cholesterol synthesis in cells treated with 0.01–10 µmol/L ZA for 24 h. Inhibition was statistically significant in HT29 (*p<0.001), HT29-dx (°p<0.01) d HMM cells (p<0.005) vs baseline values (0). Right panel: time-dependent inhibition of cholesterol synthesis in cells treated with 1 µmol/L ZA for 24–72 h. Inhibition was statistically significant in HT29 (*p<0.001), HT29-dx (°p<0.0001) and HMM cells (p<0.001) vs baseline values (0). For both panels: HT29-dx/HMM vs HT29: *p<0.001. B. MDR+ cells synthesized higher amounts of FPP (left panel) and GGPP (right panel) than MDR− cells (*p<0.005). ZA significantly lowered FPP synthesis vs untreated (CTRL) cells (HT29: *p<0.001; HT29-dx: °p<0.002; HMM: p<0.001) and GGPP synthesis vs untreated (CTRL) cells (HT29:*p<0.02; HT29-dx: °p<0.001; HMM:p<0.005). C. MDR+ cells displayed an unbalanced distribution between isoprenylated membrane-bound (M) and non isoprenylated cytosolic (C) Ras (left panel) and RhoA (right panel) compared with MDR− cells. ZA treatment increased the amount of cytosolic Ras and RhoA. T: amount of Ras and RhoA in whole cell lysates. D. ZA decreased Ras activity, measured as Ras-GTP amount, and phospho-(Thr202/Tyr204, Thr185/Tyr187)-ERK1/2 amount. GAPDH data are shown to confirm equivalent protein loading. E. MDR+ cells had significantly higher amounts of RhoA-GTP (open bars) and RhoA kinase (hatched bars) than MDR− cells (*p<0.005); ZA decreased both RhoA-GTP and RhoA kinase vs untreated (CTRL) cells (HT29-dx: °p<0.02; HMM:p<0.02). The results shown in panels C and D are representative of 3 experiments. In panels A, B, and E the results represent the mean ± SD of 3 experiments.
Figure 3
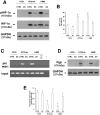
Figure 3. ZA-induced inhibition of HIF-1α activity and Pgp expression in MDR+ cancer cells.
A. Detection of phosphorylated (pHIF-1α) and total HIF-1α in MDR− HT29, and MDR+ HT29-dx and HMM cells after 48-hour incubation without (CTRL) or with 1 µmol/L ZA (ZA). B. HIF-1 activity was higher (*p<0.001) in MDR+ HT29-dx and HMM cells than HT29 cells. After ZA treatment (as reported in A), a significant decrease of HIF-1 activity was observed in HT29-dx (°p<0.001) and HMM cells (p<0.001). C. Chromatin immunoprecipitation of HIF-1α on mdr1 promoter in MDR− and MDR+ cells, treated as reported in a. pro mdr1: PCR product from immunoprecipitated samples. Input: PCR product from non immunoprecipitated samples (genomic DNA). no Ab: samples incubated in the absence of anti-HIF-1α antibody. “-”: blank. D. Western blotting detection of Pgp in cells treated as described in A. E. Intracellular doxorubicin was measured spectrofluorimetrically: significantly lower concentrations were detected in HT29-dx and HMM vs HT29 cells (*p<0.002), significantly higher concentrations in ZA-treated cells vs untreated (CTRL) counterparts (HT29-dx: °p<0.02; HMM: p<0.02). The results shown in panels A, C and D are representative of 3 experiments. For panels B and E the bars represent the mean ± SD of 3 independent experiments.
Figure 4
Figure 4. Effects of ZA and inhibitors of ERK1/2, RhoA kinase, HIF-1α on MDR+ cells.
A. Phospho(Ser)-HIF-1α (pHIF-1α) and total HIF-1α expression in HMM cells left untreated (CTRL) or treated for 24 h at 10 µmol/L with the ERK1/2 kinase inhibitor PD98059 (PD), RhoA kinase inhibitor Y27632 (Y27), HIF-1α inhibitor YC-1 (YC), and 1 µmol/L ZA for 48 h. GAPDH data are shown to confirm equivalent per lane protein loading. B. HIF-1 activity in HMM cells left untreated (CTRL) or treated as reported in panel A. All differences between treated vs untreated cells are statistically significant (* p<0.01). C. Pgp expression in HMM cells of untreated (CTRL) and treated as reported in panel A. D. Intracellular doxorubicin concentrations in HMM cells in cells incubated as reported above in medium alone (CTRL), followed by 1 µmol/L Dox for a further 24 h. Differences between treated vs untreated cells are statistically significant (*p<0.01). Results shown in panels A and C are representative data from one of 2 experiments. For panels B and D, the results represent the mean ± SD of 3 independent experiments.
Figure 5
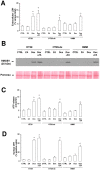
Figure 5. ZA restores doxorubicin-induced cytotoxicity and ICD in MDR+ tumor cells.
MDR− HT29 and MDR+ HT29-dx, and HMM cells were incubated for 48 h without (CTRL) or with 1 µmol/L ZA, for 24 h with 1 µmol/L Dox, for 48 h with 1 µmol/L ZA, followed by 1 µmol/L Dox for additional 24 h (ZA+Dox). A. LDH release. Dox alone and ZA+Dox induced a significant cytotoxicity in HT29 cells (*p<0.005). ZA+Dox induced a significant increase of cytotoxicity in HT29-dx (°p<0.05) and HMM cells (p<0.02). B. Western blot analysis of extracellular HMGB1. Dox alone and ZA+Dox in HT29 cells, ZA+Dox in HT29-dx and HMM cells induced the release of HMGB1 in the cell culture medium. Red Ponceau staining was used to check the equal loading of proteins. C. Extracellular release of ATP. Dox and ZA+Dox induced a significant increase of extracellular ATP in HT29 cells (*p<0.01). ZA+Dox elicited a significant release of ATP in HT29-dx (°p<0.002) and HMM cells (p<0.001). D. Cell surface CRT exposure. Dox and ZA+Dox induced a significant CRT exposure in HT29 cells (*p<0.001). ZA+Dox induced a significant CRT exposure in HT29-dx (°p<0.001) and HMM cells (p<0.005). For panels A, C and D bars represent the mean ± SD of 3 independent experiments. For panel B the results are representative data from one of 2 experiments.
Figure 6
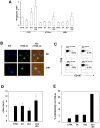
Figure 6. ZA increases the internalization of MDR+ cells by autologous DCs and the subsequent activation of cytotoxic CD8+ T cells.
A. DC-mediated internalization of HT29, HT29-dx, and HMM cells after incubation with ZA and/or Dox. Tumor cells were incubated for 48 h without (CTRL) or with 1 µmol/L ZA, for 24 h with 1 µmol/L Dox, for 48 h with 1 µmol/L ZA, followed by 1 µmol/L Dox for additional 24 h (ZA+Dox). Dox alone and ZA+Dox significantly increased internalization of HT29 cells (*p<0.02). ZA+Dox increased internalization of HT29-dx (°p<0.005) and HMM (p<0.005) cells. Results represent the mean ± SD of 3 independent experiments. B. Fluorescence microscopy analysis of HT29-dx internalization after 6 and 24 h incubation with DCs. HT29-dx cells were incubated with ZA+Dox as reported in A. Micrographs are from one representative of 3 experiments. C. Cytotoxic activation of CD8+ T cells after 10 days incubation of purified T cells with autologous DCs pulsed with HT29-dx tumor cells, treated as reported in a. Cytofluorometric analysis of cell surface CD107 expression was used as a marker of specific TCR-induced CD8+ T-cell degranulation. Results are from one representative of 4 experiments. D. Pooled data of CD107 expression on CD8+ T cells after incubation with autologous DC as reported above. Bars represent the mean ± SEM of 4 experiments.
Figure 7
Figure 7. Schematic drawing of mechanisms operated by ZA to reverse chemoresistance and immune-resistance.
A. The accelerated Mev pathway in MDR+ cells leads to the constitutive activation of Ras/ERK1-2 and RhoA/RhoA kinase downstream signalling pathways which culminates into HIF-1α activation and plasma membrane Pgp expression. The higher amounts of plasma membrane-associated cholesterol in MDR+ cells also contribute to the functional Pgp activation. The higher efficiency to extrude Dox protects MDR+ cells from cytotoxicity and ICD epitomized by CRT exposure on the cell surface. B. By inhibiting the Mev pathway, ZA downregulates the Ras/ERK1-2 and RhoA/RhoA kinase signalling pathways, and decreases the HIF-1α-induced transcription of Pgp. As a result, Dox accumulates inside MDR+ cells at sufficient amounts to induce cytotoxicity and promote CRT exposure, turning the phenotype of these cells from a chemoimmunoresistant phenotype into a chemoimmunosensitive phenotype.

Similar articles

Cited by

References

    1. Swanson KM, Hohl RJ (2006) Anti-Cancer Therapy: Targeting the Mevalonate Pathway. Curr Cancer Drug Targets 6: 15–37. - PubMed
    1. Clendening JW, Pandyra A, Boutrosa PC, El Ghamrasni S, Khosravi F, et al. (2010) Dysregulation of the mevalonate pathway promotes transformation. Proc Natl Acad Sci 107: 15051–15056. - PMC - PubMed
    1. Freed-Pastor WA, Mizuno H, Zhao X, Langerød A, Moon S-H, et al. (2012) Mutant p53 disrupts mammary tissue architecture via the mevalonate pathway. Cell 148: 244–258. - PMC - PubMed
    1. Gottesman MM, Fojo T, Bates SE (2002) Multidrug resistance in cancer: role of ATP-dependent transporters. Nat Rev Cancer 2: 48–58. - PubMed
    1. Troost J, Lindenmaie J, Haefeli WE, Weiss J (2004) Modulation of cellular cholesterol alters P-glycoprotein activity in multidrug-resistant cells. Mol Pharmacol 66: 1332–1339. - PubMed

Publication types

MeSH terms