

Autistic traits in neurotypical adults: correlates of graph theoretical functional network topology and white matter anisotropy patterns
- PMID: 23593367
- PMCID: PMC3618514
- DOI: 10.1371/journal.pone.0060982
Autistic traits in neurotypical adults: correlates of graph theoretical functional network topology and white matter anisotropy patterns
Abstract
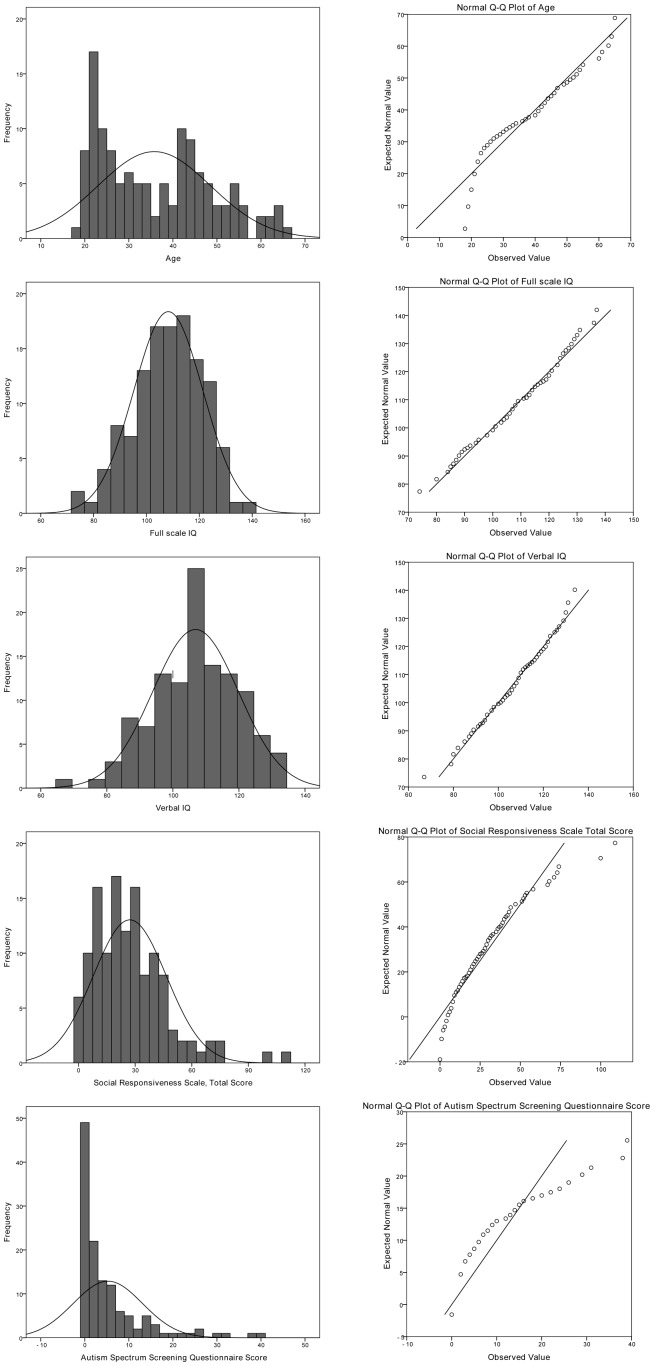
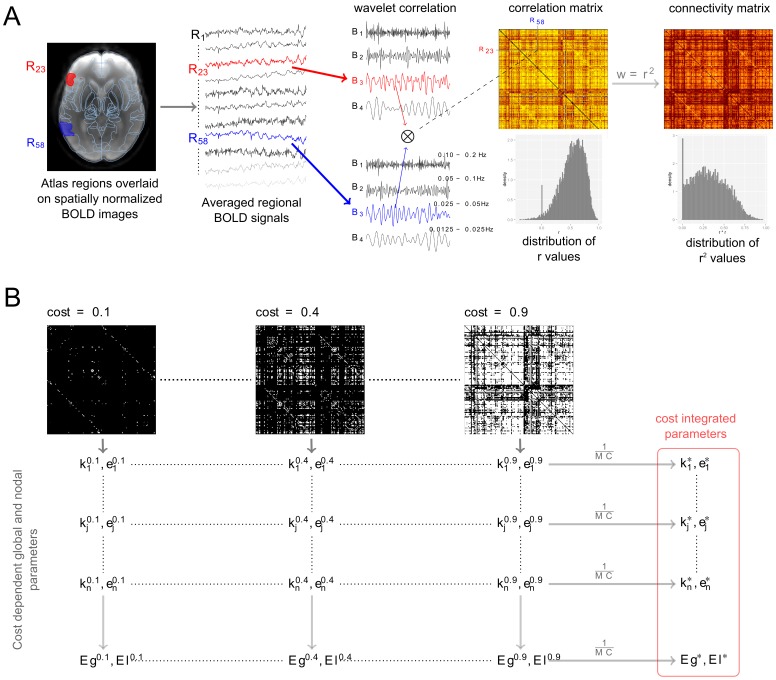
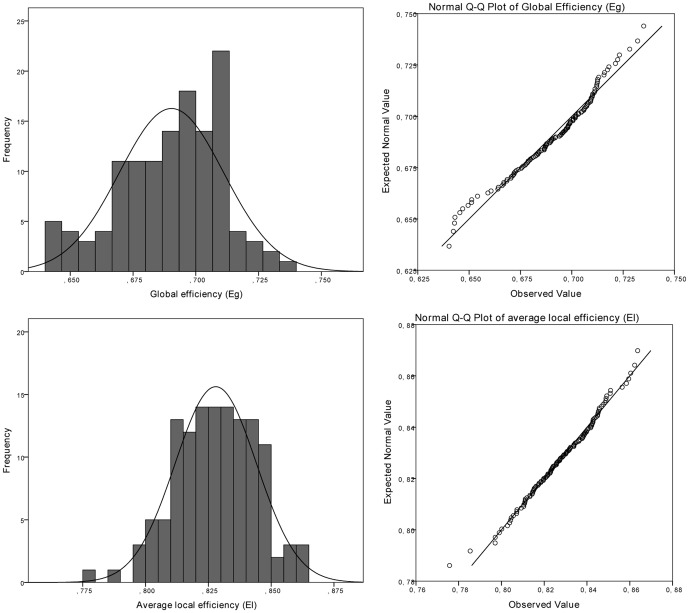
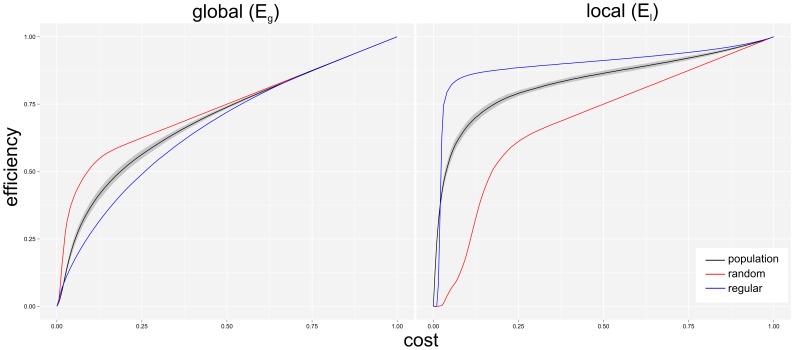
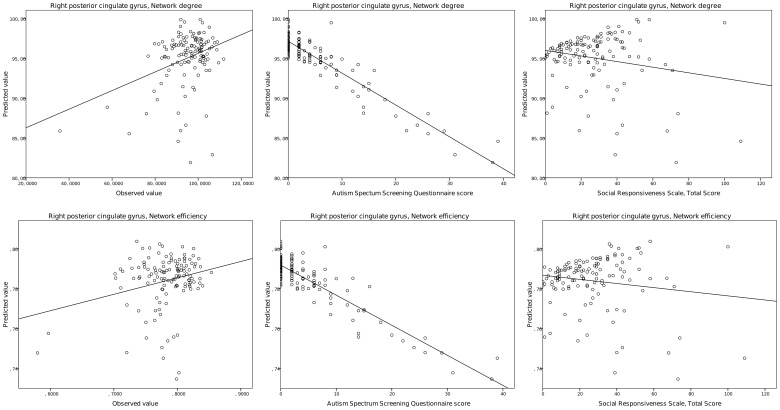
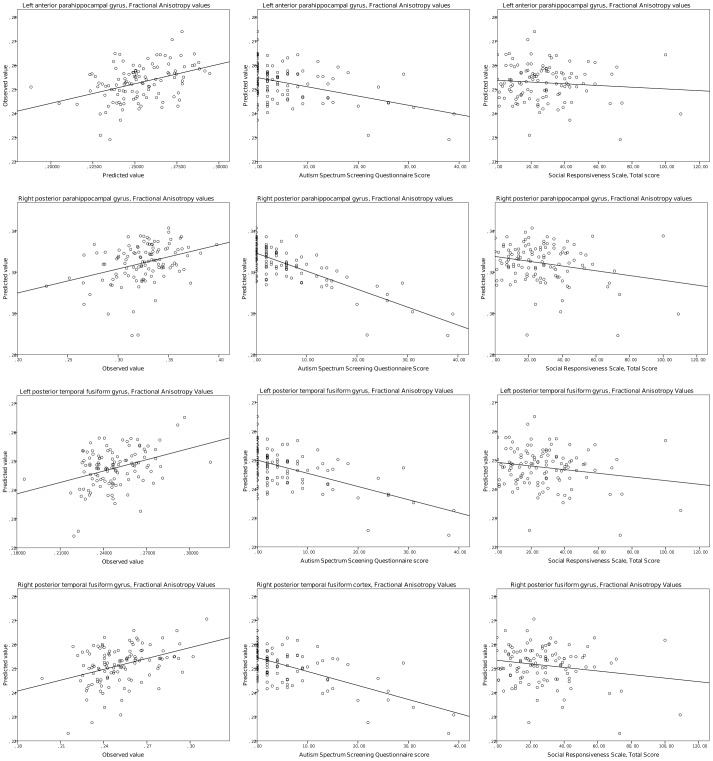
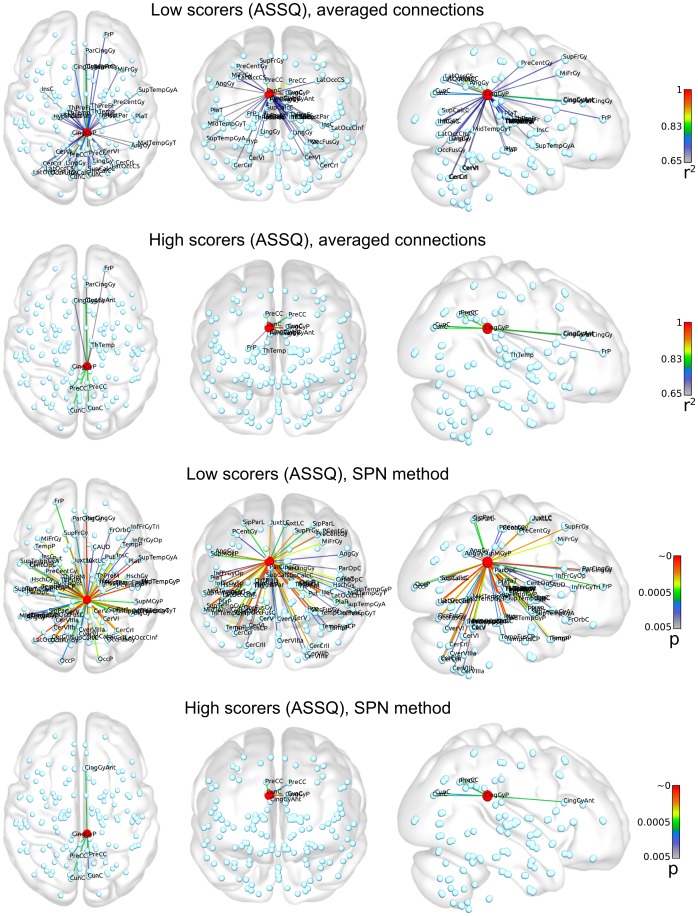
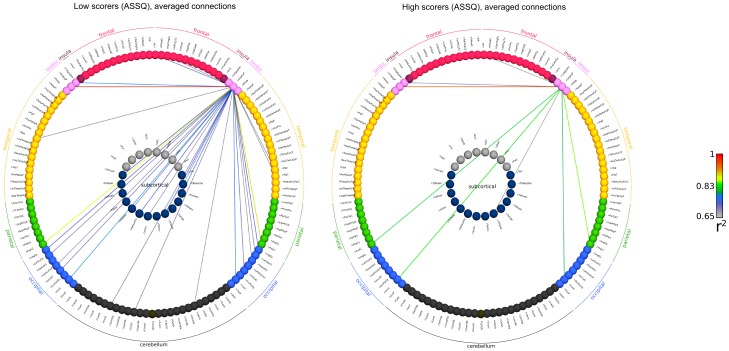
Attempts to explicate the neural abnormalities behind autism spectrum disorders frequently revealed impaired brain connectivity, yet our knowledge is limited about the alterations linked with autistic traits in the non-clinical population. In our study, we aimed at exploring the neural correlates of dimensional autistic traits using a dual approach of diffusion tensor imaging (DTI) and graph theoretical analysis of resting state functional MRI data. Subjects were sampled from a public neuroimaging dataset of healthy volunteers. Inclusion criteria were adult age (age: 18-65), availability of DTI and resting state functional acquisitions and psychological evaluation including the Social Responsiveness Scale (SRS) and Autistic Spectrum Screening Questionnaire (ASSQ). The final subject cohort consisted of 127 neurotypicals. Global brain network structure was described by graph theoretical parameters: global and average local efficiency. Regional topology was characterized by degree and efficiency. We provided measurements for diffusion anisotropy. The association between autistic traits and the neuroimaging findings was studied using a general linear model analysis, controlling for the effects of age, gender and IQ profile. Significant negative correlation was found between the degree and efficiency of the right posterior cingulate cortex and autistic traits, measured by the combination of ASSQ and SRS scores. Autistic phenotype was associated with the decrease of whole-brain local efficiency. Reduction of diffusion anisotropy was found bilaterally in the temporal fusiform and parahippocampal gyri. Numerous models describe the autistic brain connectome to be dominated by reduced long-range connections and excessive short-range fibers. Our finding of decreased efficiency supports this hypothesis although the only prominent effect was seen in the posterior limbic lobe, which is known to act as a connector hub. The neural correlates of the autistic trait in neurotypicals showed only limited similarities to the reported findings in clinical populations with low functioning autism.
Conflict of interest statement
Figures
Similar articles
-
Autistic traits and individual brain differences: functional network efficiency reflects attentional and social impairments, structural nodal efficiencies index systemising and theory-of-mind skills.Mol Autism. 2021 Jan 21;12(1):3. doi: 10.1186/s13229-020-00377-8. Mol Autism. 2021. PMID: 33478557 Free PMC article.
-
Relationship between cingulo-insular functional connectivity and autistic traits in neurotypical adults.Am J Psychiatry. 2009 Aug;166(8):891-9. doi: 10.1176/appi.ajp.2009.08121894. Epub 2009 Jul 15. Am J Psychiatry. 2009. PMID: 19605539 Free PMC article.
-
White matter reduced streamline coherence in young men with autism and mental retardation.Eur J Neurol. 2009 Nov;16(11):1185-90. doi: 10.1111/j.1468-1331.2009.02699.x. Epub 2009 Jun 15. Eur J Neurol. 2009. PMID: 19538216
-
Atypical diffusion tensor hemispheric asymmetry in autism.Autism Res. 2010 Dec;3(6):350-8. doi: 10.1002/aur.162. Epub 2010 Dec 2. Autism Res. 2010. PMID: 21182212 Free PMC article.
-
Altered white matter connectivity as a neural substrate for social impairment in Autism Spectrum Disorder.Cortex. 2015 Jan;62:158-81. doi: 10.1016/j.cortex.2014.10.014. Epub 2014 Nov 5. Cortex. 2015. PMID: 25433958 Review.
Cited by
-
Sensory and motor secondary symptoms as indicators of brain vulnerability.J Neurodev Disord. 2013 Sep 24;5(1):26. doi: 10.1186/1866-1955-5-26. J Neurodev Disord. 2013. PMID: 24063566 Free PMC article.
-
Connectomics in psychiatric research: advances and applications.Neuropsychiatr Dis Treat. 2015 Oct 29;11:2801-10. doi: 10.2147/NDT.S63470. eCollection 2015. Neuropsychiatr Dis Treat. 2015. PMID: 26604764 Free PMC article. Review.
-
Relationship between Autistic Spectrum Trait and Regional Cerebral Blood Flow in Healthy Male Subjects.Psychiatry Investig. 2018 Oct;15(10):956-961. doi: 10.30773/pi.2018.07.27. Epub 2018 Sep 13. Psychiatry Investig. 2018. PMID: 30205670 Free PMC article.
-
Head Motion and Correction Methods in Resting-state Functional MRI.Magn Reson Med Sci. 2016;15(2):178-86. doi: 10.2463/mrms.rev.2015-0060. Epub 2015 Dec 22. Magn Reson Med Sci. 2016. PMID: 26701695 Free PMC article. Review.
-
Toward Developmental Connectomics of the Human Brain.Front Neuroanat. 2016 Mar 31;10:25. doi: 10.3389/fnana.2016.00025. eCollection 2016. Front Neuroanat. 2016. PMID: 27064378 Free PMC article. Review.
References
-
- APA (2007) Diagnostic and Statistical Manual of Mental Disorders, Fourth Edition, Text Revision. Washington DC: American Psychiatric Association.
-
- Baron-Cohen S, Jolliffe T, Mortimore C, Robertson M (1997) Another advanced test of theory of mind: evidence from very high functioning adults with autism or Asperger Syndrome. J Child Psychol Psychiatry 38: 813–822. - PubMed
-
- Bauman ML, Kemper TL (2005) Neuroanatomic observations of the brain in autism: a review and future directions. Int J Dev Neurosci 23: 183–187. - PubMed
-
- Aylward EH, Minshew NJ, Field K, Sparks BF, Singh N (2002) Effects of age on brain volume and head circumference in autism. Neurology 59: 175–183. - PubMed
-
- Courchesne E, Pierce K, Schumann CM, Redcay E, Buckwalter JA, et al. (2007) Mapping early brain development in autism. Neuron 56: 399–413. - PubMed
Publication types
MeSH terms
Grants and funding
LinkOut - more resources
Full Text Sources
Other Literature Sources
