. 2013 Apr 12;8(4):e61003.
doi: 10.1371/journal.pone.0061003. Print 2013.

Sequence analysis of 96 genomic regions identifies distinct evolutionary lineages within CC156, the largest Streptococcus pneumoniae clonal complex in the MLST database

Affiliations

Sequence analysis of 96 genomic regions identifies distinct evolutionary lineages within CC156, the largest Streptococcus pneumoniae clonal complex in the MLST database

Monica Moschioni et al. PLoS One. .

Abstract

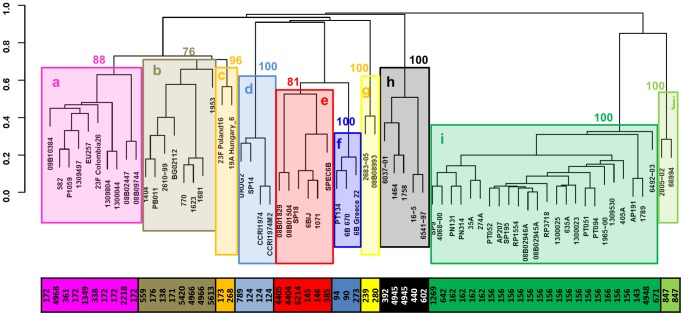
Multi-Locus Sequence Typing (MLST) of Streptococcus pneumoniae is based on the sequence of seven housekeeping gene fragments. The analysis of MLST allelic profiles by eBURST allows the grouping of genetically related strains into Clonal Complexes (CCs) including those genotypes with a common descent from a predicted ancestor. However, the increasing use of MLST to characterize S. pneumoniae strains has led to the identification of a large number of new Sequence Types (STs) causing the merger of formerly distinct lineages into larger CCs. An example of this is the CC156, displaying a high level of complexity and including strains with allelic profiles differing in all seven of the MLST loci, capsular type and the presence of the Pilus Islet-1 (PI-1). Detailed analysis of the CC156 indicates that the identification of new STs, such as ST4945, induced the merging of formerly distinct clonal complexes. In order to discriminate the strain diversity within CC156, a recently developed typing schema, 96-MLST, was used to analyse 66 strains representative of 41 different STs. Analysis of allelic profiles by hierarchical clustering and a minimum spanning tree identified ten genetically distinct evolutionary lineages. Similar results were obtained by phylogenetic analysis on the concatenated sequences with different methods. The identified lineages are homogenous in capsular type and PI-1 presence. ST4945 strains were unequivocally assigned to one of the lineages. In conclusion, the identification of new STs through an exhaustive analysis of pneumococcal strains from various laboratories has highlighted that potentially unrelated subgroups can be grouped into a single CC by eBURST. The analysis of additional loci, such as those included in the 96-MLST schema, will be necessary to accurately discriminate the clonal evolution of the pneumococcal population.


Conflict of interest statement

Competing Interests: All the authors of the manuscript are or were (at the time the work presented in the manuscript was performed)employed at Novartis Vaccines and Diagnostics. This does not alter the authors' adherence to all the PLOS ONE policies on sharing data and materials.

Figures

Figure 1
Figure 1. Graphic representation of CC156 by e-BURST.
A) In the absence of ST4945 CC156 is partitioned in three different CCs by e-BURST analysis. B) 32 out of the 41 CC156 STs analyzed differ in four or more than four alleles from the founder ST, ST156. The MLST database was accessed on 15h January 2012 and CC156 visualized using eBURST (the e-BURST algorithm was executed on a dataset comprising all the STs in the database represented once). A) Shadowed shapes indicate the partitioning in distinct CCs of CC156 (CC162 blue, CC124 red, CC176 green) when eBURST was executed with the same ST dataset but excluding ST4945. ST156 and ST4945 are highlighted in red, while all the other STs analysed in this study are in black. B) The STs analysed in this study are highlighted and colour coded based on the number of MLST alleles in common with the predicted founder, ST156 (colour coding is indicated in the Figure).
Figure 2
Figure 2. Hierarchical clustering performed on the 96-MLST alleles identifies ten genetically distinct evolutionary lineages (a-j) within the 66 CC156 strains analyzed.
Sequences were converted into allelic profiles assigning a unique ID number to each allele. Hierarchical clustering was performed using the package Cluster v1.13.1. Distances between strains were computed using the function “Daisy” with Gower’s distance, counting the number of differences between allelic profiles. An agglomerative hierarchical clustering of the data was performed using the function “Agnes” with “average” (unweighted pair-group average method – UPGMA) method. The ten lineages identified (a-j) are indicated by coloured boxes, and numbers represent the bootstrap support. The STs of all the strains are indicated in the coloured bar.
Figure 3
Figure 3. Minimum Spanning Tree analysis based on 96-MLST allelic profiles identifies seven distinct lineages by imposing a maximum threshold of 75 different loci.
The Minimum Spanning Tree analysis was performed by using PHYLOVIZ on the 96-MLST alleles of the 66 strains considered in this study. The lineages identified by applying the threshold of 75/96 different loci are highlighted with shadowed shapes and named according to the lineage identification of Figure 2.
Figure 4
Figure 4. ST4945 can be unequivocally assigned to one of the identified lineages.
The distribution of the 7-MLST and the 96-MLST alleles was analysed by assigning identical colours to identical alleles across the strains (white = unique alleles). Red arrows indicate ST4945 strains, while black and orange arrows indicate single and double 7-MLST locus variants of ST4945, respectively. The 96-MLST loci are listed according to their order in the genome.
Figure 5
Figure 5. The CC156 lineages (a-j) identified with the hierarchical clustering (shadowed shapes) as defined in Figure 2 correlate with the ST distribution in the eBURST diagram and with PI-1 distribution.
STs are indicated with different colours depending on PI-1 presence/absence as indicated in the Figure legend.

Similar articles

Cited by

References

    1. O’Brien KL, Wolfson LJ, Watt JP, Henkle E, oria-Knoll M, et al. (2009) Burden of disease caused by Streptococcus pneumoniae in children younger than 5 years: global estimates. Lancet 374: 893–902. - PubMed
    1. van der Poll T, Opal SM (2009) Pathogenesis, treatment, and prevention of pneumococcal pneumonia. Lancet 374: 1543–1556. - PubMed
    1. Weiser JN (2010) The pneumococcus: why a commensal misbehaves. J Mol Med 88: 97–102 doi:10.1007/s00109-009-0557-x. - DOI - PMC - PubMed
    1. Pelton SI, Leibovitz E (2009) Recent advances in otitis media. Pediatr Infect Dis J 28: S133–S137. - PubMed
    1. Sadowy E, Kuch A, Gniadkowski M, Hryniewicz W (2010) Expansion and evolution of the Streptococcus pneumoniae Spain9V-ST156 clonal complex in Poland. Antimicrob Agents Chemother 54: 1720–1727. - PMC - PubMed