. 2013 Apr 12;8(4):e61143.
doi: 10.1371/journal.pone.0061143. Print 2013.

Chromatin relaxation-mediated induction of p19INK4d increases the ability of cells to repair damaged DNA

Affiliations

Chromatin relaxation-mediated induction of p19INK4d increases the ability of cells to repair damaged DNA

María F Ogara et al. PLoS One. .

Abstract

The maintenance of genomic integrity is of main importance to the survival and health of organisms which are continuously exposed to genotoxic stress. Cells respond to DNA damage by activating survival pathways consisting of cell cycle checkpoints and repair mechanisms. However, the signal that triggers the DNA damage response is not necessarily a direct detection of the primary DNA lesion. In fact, chromatin defects may serve as initiating signals to activate those mechanisms. If the modulation of chromatin structure could initiate a checkpoint response in a direct manner, this supposes the existence of specific chromatin sensors. p19INK4d, a member of the INK4 cell cycle inhibitors, plays a crucial role in regulating genomic stability and cell viability by enhancing DNA repair. Its expression is induced in cells injured by one of several genotoxic treatments like cis-platin, UV light or neocarzinostatin. Nevertheless, when exogenous DNA damaged molecules are introduced into the cell, this induction is not observed. Here, we show that p19INK4d is enhanced after chromatin relaxation even in the absence of DNA damage. This induction was shown to depend upon ATM/ATR, Chk1/Chk2 and E2F activity, as is the case of p19INK4d induction by endogenous DNA damage. Interestingly, p19INK4d improves DNA repair when the genotoxic damage is caused in a relaxed-chromatin context. These results suggest that changes in chromatin structure, and not DNA damage itself, is the actual trigger of p19INK4d induction. We propose that, in addition to its role as a cell cycle inhibitor, p19INK4d could participate in a signaling network directed to detecting and eventually responding to chromatin anomalies.


Conflict of interest statement

Competing Interests: The authors have declared that no competing interests exist.

Figures

Figure 1
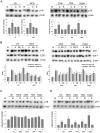
Figure 1. Chromatin relaxation triggers the induction of p19.
A. HEK-293 cells were incubated with 100 µM chloroquine or 200 nM TSA or hypotonic medium (50 mM NaCl) as indicated. Total RNA (10 µg) extracted from cells at the indicated times were subjected to northern blot analysis with the 32P-labeled probes specified at the right margin. B. HEK-293 cells were irradiated with 40 J/m2 or incubated with 50 ng/ml NCS. The expression of p19 was assessed by northern blot. C and E. HEK-293 cells (C) or SH-SY5Y cells (E) were irradiated with 40 J/m2 UV or incubated with 100 µM chloroquine or 200 nM TSA or hypotonic medium and cell lysates prepared at the indicated times. Western blot analysis of p19 were carried out with 20 µg of total cellular proteins and detected with p19 monoclonal antibody. Anti-β-actin antibody was uses as a protein loading control. D. SH-SY5Y cells were irradiated with 40 J/m2 UV or incubated with 100 µM chloroquine or 200 nM TSA or hypotonic medium (50 mM NaCl) as indicated. Total RNA (10 µg) extracted from cells at the indicated times were subjected to northern blot analysis with the 32P-labeled probes specified at the right margin. In all cases (AE) results are representative of three independent experiments with similar results. Densitometric analysis of p19 is represented in the lower panels. Bars represent the mean ± S.D. of three experiments. Student’s t-test was used to compare samples obtained at different times with samples obtained at zero time (* p<0.05, at least). Chloroquine (chlo), hypotonic medium (hypo), β-tubulin (β-tub), neocarzinostatin (NCS).
Figure 2
Figure 2. DNA damage or chromatin relaxation induces E2F1 and p19 through ATM/ATR-Chk1/Chk2 signaling.
A. HEK-293 cells, previously treated with 10 µM Ku-55933 or 5 mM caffeine for 1 h, were exposed to 40 J/m2 UV or 50 ng/ml neocarzinostatin (left panel) or incubated with 100 µM chloroquine or 200 nM TSA or subjected to hypotonic medium (right panel). B. HEK-293 cells, previously treated with 10 µM Ku-55933 or 15 nM SB-218078 or 20 nM Chk2 inhibitor for 1 h, were exposed to 40 J/m2 UV or 50 ng/ml neocarzinostatin (left panel) or incubated with 100 µM chloroquine or 200 nM TSA or subjected to hypotonic medium (right panel). In (A) and (B) after 4 h, cells were harvested and subjected to northern blot analysis using a 32P-labelled probe specific for human p19 mRNA and reprobed for E2F1 and β-tubulin mRNA. C and D. ATM-deficient Seckel cells (C) or primary human fibroblasts C5RO (D), previously treated with 10 µM Ku-55933, were exposed to 40 J/m2 UV or 50 ng/ml neocarzinostatin or incubated with 100 µM chloroquine or 200 nM TSA or subjected to hypotonic medium (50 mM NaCl). In (C) and (D) after 4 h, cells were harvested and subjected to northern blot analysis using a 32P-labelled probe specific for human p19 mRNA and reprobed for β-tubulin mRNA. Each figure shows a representative autoradiograph of three independent experiments with similar results. Densitometric analysis of p19 and E2F1 are represented in the lower panels. Bars represent the mean ± S.D. of three experiments. Student’s t-test was used to compare treated and non-treated samples (* p<0.05, at least). None (N), β-tubulin (β-tub), caffeine (C), Ku-55933 (K), chloroquine (chlo), hypotonic medium (hypo), SB-218078 (SB), Chk2 inhibitor (2I).
Figure 3
Figure 3. Chromatin relaxation-mediated induction of p19 is specific.
A. HEK-293 cells, previously treated or not with 5 mM caffeine during 1 h, were incubated at 43°C for 1 h and then cultured at 37°C from 0 to 8 h. B. HEK-293 cells, previously treated with 5 mM caffeine for 1 h, were incubated with 100 µM chloroquine at the indicated times. In (A) and (B), cells were harvested and subjected to northern blot analysis using a 32P-labelled probe specified at the right margin. Each figure shows a representative autoradiograph of three independent experiments with similar results. Densitometric analysis of p19, p21 and c-fos are represented in the lower panels. Bars represent the mean ± S.D. of three experiments. Student’s t-test was used to compare samples obtained at different times with samples obtained at zero time (* p<0.05, at least). β-tubulin (β-tub), heat shock (HS), caffeine (caff), chloroquine (chlo).
Figure 4
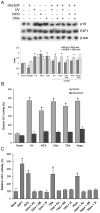
Figure 4. E2F mediates induction of p19 in response to DNA damage or chromatin relaxation.
A. HEK-293 cells were transfected with 500 nM E2F decoy oligonucleotide. Twenty four hours later, cells were exposed to 40 J/m2 UV or 50 ng/ml NCS and incubated in the presence or in the absence of 100 µM chloroquine. After 4 h, cells were harvested and subjected to northern blot analysis using a 32P-labelled probe specific for human p19 mRNA and reprobed for E2F1 and β-tubulin mRNA. Figure shows a representative autoradiograph of three independent experiments with similar results. Densitometric analysis of p19 and E2F1 are represented in the lower panel. Bars represent the mean ± S.E of three experiments. Student’s t-test was used to compare treated and non-treated samples (* p<0.05, at least). B. HEK-293 cells transiently cotransfected with 4 µg of p19CAT, or equivalent amount of mutant plasmid, containing the 5′-flanking region of p19 gene and 5 µg pCEFL-β-galactosidase were exposed to 40 J/m2 UV or incubated with 50 ng/ml NCS or 100 µM chloroquine or 200 nM TSA or hypotonic medium. After 24 h cells were harvested and CAT activity was determined as described. Results are expressed as relative CAT activity with respect to basal value of p19CAT which was set to 100. Bars represent the mean ± S.D. of three independent experiments performed in quadruplicate. Student’s t-test was used to compare treated with non treated samples (* p<0.01). C. HEK-293 cells, transiently cotransfected with 4 µg of pE2F4XCAT and 5 µg pCEFL-β-galactosidase and, when indicated, 4 µg of a vector expressing E2F1 cDNA, were treated with 100 µM chloroquine, or 200 nM TSA or subjected to hypotonic medium and incubated in the presence or in the absence of 10 µM Ku-55933 or 15 nM SB-218078 or 20 nM Chk2 inhibitor. After 24 h cells were harvested and CAT activity was determined as described. Results are expressed as relative CAT activity with respect to basal value of pE2F4XCAT which was set to 100. Bars represent the mean ± S.D. of three independent experiments performed in quadruplicate. Student’s t-test was used to compare treated with non treated samples (* p<0.01). Decoy E2F oligonucleotide (DecE2F), β-tubulin (β-tub), chloroquine (chlo), hypotonic medium (hypo), neocarzinostatin (NCS), Ku-55933 (Ku), SB-218078 (SB), Chk2 inhibitor (2I).
Figure 5
Figure 5. Absence of synergism of genotoxins and chromatin modifiers effects on p19 induction.
A. HEK-293 cells were exposed to 40 J/m2 UV or 50 ng/ml neocarzinostatin and incubated in the presence or in the absence of 100 µM chloroquine, or 200 nM TSA or hypotonic medium. After 4 h, cells were harvested and subjected to northern blot analysis using a 32P-labelled probe specific for human p19 mRNA and reprobed for E2F1 and β-tubulin mRNA. B. HEK-293 cells were transfected with increasing levels of an expression vector encoding E2F1 gene, harvested after 24 h, and p19 and E2F1 expression assessed by northern blot. In parallel cells were incubated with 100 µM chloroquine or 200 nM trichostatin A or hypotonic medium or exposed to 40 J/m2 UV as indicated. After 4 h p19 and E2F1 expression was determined by northern blot. In (A) and (B) each figure shows a representative autoradiograph of three independent experiments with similar results. Densitometric analysis of p19 and E2F1 are represented in the lower panels. Bars represent the mean ± S.D. of three experiments. Student’s t-test was used to compare treated and non-treated samples (* p<0.05, at least). C. HEK-293 cells, transiently cotransfected with 4 µg of p19CAT and 5 µg pCEFL-β-galactosidase, were exposed to 40 J/m2 UV or treated with 50 ng/ml NCS and incubated in the presence or in the absence of 100 µM chloroquine or 200 nM TSA or hypotonic medium. After 24 h cells were harvested and CAT activity was determined as described. Results are expressed as relative CAT activity with respect to basal value of p19CAT which was set to 100. Bars represent the mean ± S.D. of three independent experiments performed in quadruplicate. β-tubulin (β-tub), chloroquine (chlo), neocarzinostatin (NCS), hypotonic medium (hypo).
Figure 6
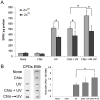
Figure 6. Chloroquine-mediated induction of p19 increases the ability of Neuro-2a cells to repair UV-damaged DNA.
A. Stably transfected p19 AS Neuro-2a cells were cultured in a serum free-medium during 24 h, and then incubated with 50 µM ZnSO4 during 16 h. After this time, cells were treated with 100 µM chloroquine and, simultaneously (chlo+UV) or after 4 h (chlo → UV) irradiated with 40 J/m2 UV, and incubated with 10 µCi/ml [3H]thymidine for 10 h. Cell lysates were tested for unscheduled DNA synthesis assay. Bars represent the mean ± S.D. of three different experiments performed in triplicate. Student’s t-test was used to compare Zn2+-treated with non treated samples (* p<0.05) and to compare chloroquine → UV-treated with chloroquine+UV-treated from stable transfectant samples (* p<0.05). B. Neuro-2a cells were assayed for the presence of CPD lesions. Stably transfected p19AS Neuro-2a cells were incubated in a free-Zn2+ medium and treated with 100 µM chloroquine and, simultaneously (Chlo+UV) or after 4 h (chlo → UV) irradiated with 40 J/m2 UV. Immediately after UV irradiation, cells were harvested, DNA isolated and examined for the presence of CPD lesions by immuno-slot blot using and specific antibody. Ethidium bromide staining was used to ensure equal protein content. Figure shows a representative photograph of three independent experiments. Densitometric analysis of CPD lesions is represented in the right panel. Bars represent the mean ± S.D. of three experiments performed in triplicate. Student’s t-test was used to compare samples treated with choroquine → UV with samples treated with UV. (* p<0.05). Chloroquine (Chlo), EtBr (ethidium bromide).
Figure 7
Figure 7. Chromatin-based defects as inducers of p19 protein.
Chromatin structure defects can trigger ATM/ATR and Chk1/Chk2 activation leading to an increase in E2F1 protein levels as a result of transcriptional induction. E2F1 upregulation induces the transcription of p19 which, in turn, promotes DNA repair.

Similar articles

Cited by

References

    1. Groth A, Rocha W, Verreault A, Almouzni G (2007) Chromatin challenges during DNA replication and repair. Cell 128: 721–733. - PubMed
    1. Loizou JI, Murr R, Finkbeiner MG, Sawan C, Wang ZQ, et al. (2006) Epigenetic information in chromatin: the code of entry for DNA repair. Cell Cycle 5: 696–701. - PubMed
    1. Celeste A, Fernandez-Capetillo O, Kruhlak MJ, Pilch DR, Staudt DW, et al. (2003) Histone H2AX phosphorylation is dispensable for the initial recognition of DNA breaks. Nat Cell Biol 5: 675–679. - PubMed
    1. Fernandez-Capetillo O, Celeste A, Nussenzweig A (2003) Focusing on foci: H2AX and the recruitment of DNA-damage response factors. Cell Cycle 2: 426–427. - PubMed
    1. Matsuoka S, Ballif BA, Smogorzewska A, McDonald ER, 3rd, Hurov KE, et al (2007) ATM and ATR substrate analysis reveals extensive protein networks responsive to DNA damage. Science 316: 1160–1166. - PubMed

Publication types

MeSH terms