. 2013 Apr 12;8(4):e61222.
doi: 10.1371/journal.pone.0061222. Print 2013.

Understanding the folding-function tradeoff in proteins

Affiliations

Understanding the folding-function tradeoff in proteins

Shachi Gosavi. PLoS One. .

Abstract

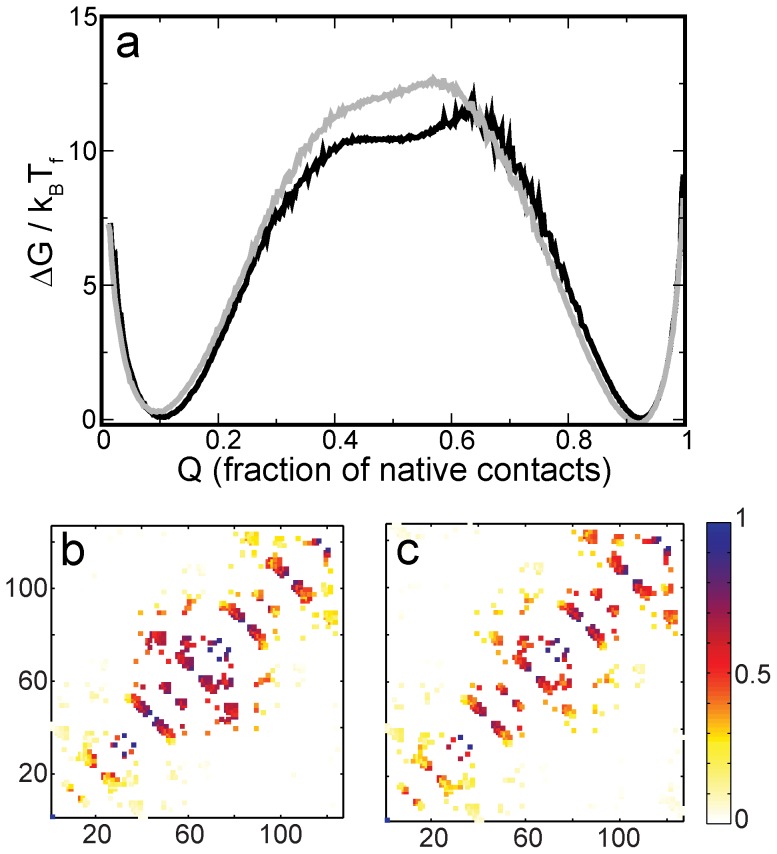
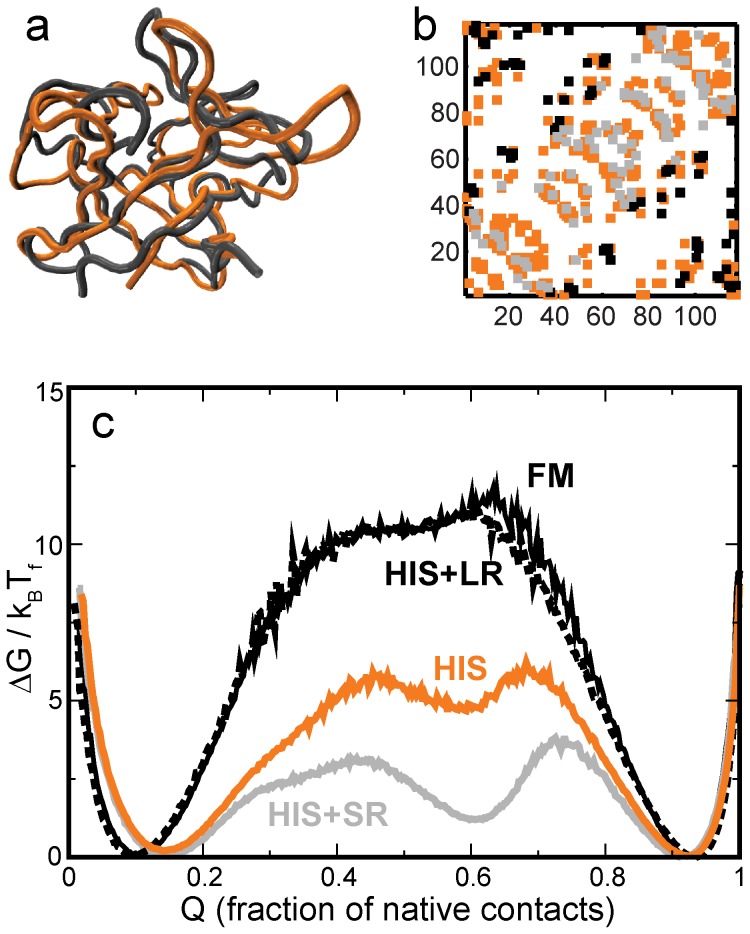
When an amino-acid sequence cannot be optimized for both folding and function, folding can get compromised in favor of function. To understand this tradeoff better, we devise a novel method for extracting the "function-less" folding-motif of a protein fold from a set of structurally similar but functionally diverse proteins. We then obtain the β-trefoil folding-motif, and study its folding using structure-based models and molecular dynamics simulations. CompariA protein sequence serves two purpson with the folding of wild-type β-trefoil proteins shows that function affects folding in two ways: In the slower folding interleukin-1β, binding sites make the fold more complex, increase contact order and slow folding. In the faster folding hisactophilin, residues which could have been part of the folding-motif are used for function. This reduces the density of native contacts in functional regions and increases folding rate. The folding-motif helps identify subtle structural deviations which perturb folding. These may then be used for functional annotation. Further, the folding-motif could potentially be used as a first step in the sequence design of function-less scaffold proteins. Desired function can then be engineered into these scaffolds.


Conflict of interest statement

Competing Interests: The author has declared that no competing interests exist.

Figures

Figure 1
Figure 1. Design of the folding motif (FM).
(a) Cartoon of the β-trefoil fold. The three pseudo-symmetric trefoil units are shown in different shades of blue. The two edge strands of trefoil 1 and 3 hydrogen bond (represented by arrows) to form the barrel. The red loo"sps vary in length and secondary structural content across different β-trefoil proteins. (b) A representative structural alignment of the 13 proteins used for the FM design. The colouring shows the most similar regions (blue) and the least similar regions (red). All protein figures are plotted using VMD . (b) Part of the structure alignment derived sequence alignment of the 13 proteins. Each of the lines of sequence shown is from a different protein. A residue position is chosen to be part of the FM if it contains a residue and not a gap in at least 7 of the proteins. A chosen position and a rejected position are shown for illustration. (c) The backbone of the FM derived from this construction has 127 residues. The view of the FM is the same as that of the aligned proteins in (a). (d) Two slightly different contact maps for the FM. The x and the y axes show the residue index of the FM. If an interaction is present between residues ‘i’ and ‘j’ of the FM then filled boxes are marked on the contact map at (i,j) and (j,i). The first map with fewer contacts (348 in number) is depicted in grey. The second map includes both the grey and the black contacts (totally 395). The three squares enclose the intra-trefoil contacts of the first (N-terminal), second (central) and the third (C-terminal) trefoils and demonstrate the three-fold pseudo-symmetry of the β-trefoil fold. As detailed in the text, the FM maps are derived from the contact maps of the WT proteins and not directly from the FM backbone.
Figure 2
Figure 2. Picking residues and contact maps for the FM.
(a) The number of residue positions (see Fig. 1c) that would be in the FM is plotted against the minimum number of proteins that must have an amino-acid (and not a gap) in the alignment at each position. In the FM, a residue position is chosen if an amino-acid is present in 7 or more proteins. This is marked with a circle on the plot. Note that the FM occurs in the flat part of the plot. This means that the number of chosen residues changes by little if the minimum number of proteins is changed by ±1, and the choice of 7 does not make a large difference to the FM. (b) The packing fraction (total number of contacts/the total number of residues) for the 13 proteins used to create the FM is sorted in descending order and marked by red circles. The two contact maps chosen for the FM (Fig. 1e) have packing fractions slightly above and below that of the median of the 13 proteins and these are marked by grey dashed lines. Optimizing Cα-Cα distance in the FM. (c) A structural alignment of the FM before (green) and after (grey) optimization. The dashed circles show differences in loops that are clearly visible. Overall, the largest changes occur in the loop regions. (d) Normalized histograms of Cα-Cα distances: The histogram of the Cα-Cα distances from the 13 proteins used to create the FM is shown in brown. In green is the histogram of Cα-Cα distances from the FM before optimization (green structure in (a)). In dashed grey is the histogram of the FM distances after optimization (grey structure in (a)).
Figure 3
Figure 3. Variability among FMs.
(a) An alignment of the FM backbone (Fig. 1d) with the backbones of 5 other β-trefoil FMs generated using 5 different sets of 13 WT proteins. The most similar regions are shown in blue while the least similar ones are shown in red. Most of the barrel and cap β-strand C-α atoms are so structurally conserved that the aligned backbones merge and only a single backbone can be observed (for comparison, see Fig. 1b and 1d). The differences between the FMs lie mainly in the loop and turn regions. (b) A composite of the contact maps of the 6 backbones. On the x and the y axes, the residues are numbered according to their order in the structural alignment shown in 3a. This order is calculated from an output similar to the one shown in Fig. 1c. The colour of a contact indicates the number of FMs that the contact is common to.
Figure 4
Figure 4. Folding barriers and routes for the FM.
(a) Free energy profiles (in scaled units) of the FM for the two contact maps shown in Fig. 1e plotted as a function of the fraction of native contacts. The profile for the grey contact map is in grey. The profile for the grey+black contact map is in black. Although the profiles have different barrier shapes the maximal heights of both are almost the same. (b) Average contact map associated with the black free energy profile when that protein is 45% folded or Q = 0.45. The colour bar provides a measure of how formed a contact is on average, with one indicating completely formed and zero not formed. (c) Average contact map associated with the grey free energy profile when Q = 0.45. (b) and (c) illustrate the change in dominant folding route upon altering the contact map. The specific value of Q = 0.45 is chosen because it best differentiates between the folding routes.
Figure 5
Figure 5. Binding sites make folding more complex in IL-1β.
(a) Structural alignment of the FM (grey) and IL-1β (6I1B; cyan). Several loops of IL-1β are longer and more structured than those of the FM. Residues present only in IL-1β are marked by blue spheres. These residues correspond well with known binding sites of IL-1β –. The circled residues show the B-binding site. Removing this site reduces backtracking . (b) Contact map of IL-1β projected onto the FM (contacts of IL-1β between residues which have a corresponding aligned residue in FM) is marked in cyan. Rest of the IL-1β contacts are marked in blue. The circled blue contacts are part of the B-binding site and are absent in the hybrid-IL-1β. Residue numbering is that of IL-1β. (c) Free energy profiles of IL-1β (blue), FM (black) and the hybrid (FM backbone + cyan contact map; cyan). Although the shapes of the barriers are different, the barrier height of the hybrid profile is almost the same as that of the FM. (d) Average contact maps of IL-1β (cyan backbone in (a); blue and cyan contacts in (b); blue free energy profile in (c)) and of the hybrid-IL-1β (grey backbone in (a); cyan contacts in (b); cyan free energy profile in (c)) at Q = 0.25 and Q = 0.35, respectively. The circled contacts in IL-1β form early but are not present when the protein is 35% folded. These contacts show the primary region of backtracking. There is little backtracking in hybrid-IL-1β. As in Fig. 4b and 4c, the colour bar provides a measure for how folded a contact is on average. The values of Q = 0.25 and Q = 0.35 are chosen because they best illustrate the change in backtracking between the two proteins.
Figure 6
Figure 6. A comparison of the structure and folding of hisactophilin (HIS) with that of the FM.
(a) Structural alignment of the FM (grey) and HIS (1HCD; orange). HIS is shorter than the FM and, except for the loop seen on the top right, loops of HIS are shorter than those of FM. (b) Contact map of HIS shown in orange. FM contacts projected onto the HIS backbone are shown in grey and black. Short-ranged (SR) contacts (with short loop lengths [58]) present only in the FM are shown in grey. Long-ranged contacts present only in the FM are shown in black. Contacts common to both HIS and FM are part of the orange HIS contact map and not shown separately. (c) Free energy profiles of the HIS backbone with different contact maps. The HIS+SR protein has the orange and grey contacts from (b) while the HIS+LR (black dashed line) has the orange and the black contacts from (b). The black contacts from (b) increase the barrier to folding to the same level as that of FM (black solid line).
Figure 7
Figure 7. Binding sites decrease the barrier to folding in hisactophilin.
(a) Structure of HIS (orange) with key myristoyl binding residues , marked in grey. In order to accommodate and bind the myristoyl chain the grey residues do not have the contacts marked in green (M) with the green residues. The FM has these contacts. (b) Structure of HIS (orange) with a cluster of putative actin binding residues marked in grey. The FM has the contacts between the grey and the yellow residues (marked in yellow; A) while HIS does not have them. (c) The HIS contact map (orange) with chosen long-ranged FM contacts (B: green, yellow and black. These contacts are marked at twice the size of the other contacts.). The green contacts denote the myristoyl binding site and are the same as shown in (a). The yellow contacts are the ones shown in (b). The black contacts do not form a structural cluster and we do not use them in independent simulations. Details of how the contacts are chosen are given in the text. (d) Free energy profiles of the HIS backbone with different contact maps. The HIS+M protein has the orange and green contacts from (c), the HIS+A protein has the orange and yellow contacts from (c), and the HIS+B protein (black dashed line) has all (orange, green, yellow and black) the contacts shown in (b). The folding barrier of HIS+B is almost as high as that of the FM (black solid line).
Figure 8
Figure 8. The folding-function tradeoff.
Cartoon of an ideal β-trefoil fold (the hairpin triplet cap is shown in dark grey while the barrel is in pale grey) and two ways in which function can be introduced into it. On the left is a representation of what happens in the case of IL-1β, where function is added through extra structural elements. The binding partner is shown as a black crescent. On the right is a cartoon of HIS. Here fold residues are reassigned to create a cavity (dashed square) within the fold. The cavity is used to sequester the N-terminal myristoyl chain.

Similar articles

Cited by

References

    1. Schug A, Whitford PC, Levy Y, Onuchic JN (2007) Mutations as trapdoors to two competing native conformations of the Rop-dimer. Proc Natl Acad Sci USA 104: 17674–17679. - PMC - PubMed
    1. Kloczkowski A, Sen TZ, Jernigan RL (2005) Promiscuous vs. native protein function. Insights from studying collective motions in proteins with elastic network models. J Biomol Struct Dyn 22: 621–624 and references therein.
    1. Wang J, Lu Q, Lu HP (2006) Single-molecule dynamics reveals cooperative binding-folding in protein recognition. PLoS Comp Biol 2: e78. - PMC - PubMed
    1. Tsai CJ, Kumar S, Ma B, Nussinov R (1999) Folding funnels, binding funnels, and protein function. Prot Sci 8: 1181–1190. - PMC - PubMed
    1. Frauenfelder H, Sligar SG, Wolynes PG (1991) The energy landscapes and motions of proteins. Science 254: 1598–1603. - PubMed

Publication types