Spatio-temporal dynamics of cholera during the first year of the epidemic in Haiti
- PMID: 23593516
- PMCID: PMC3617102
- DOI: 10.1371/journal.pntd.0002145
Spatio-temporal dynamics of cholera during the first year of the epidemic in Haiti
Abstract
Background: In October 2010, cholera importation in Haiti triggered an epidemic that rapidly proved to be the world's largest epidemic of the seventh cholera pandemic. To establish effective control and elimination policies, strategies rely on the analysis of cholera dynamics. In this report, we describe the spatio-temporal dynamics of cholera and the associated environmental factors.
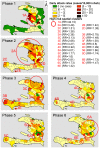
Methodology/principal findings: Cholera-associated morbidity and mortality data were prospectively collected at the commune level according to the World Health Organization standard definition. Attack and mortality rates were estimated and mapped to assess epidemic clusters and trends. The relationships between environmental factors were assessed at the commune level using multivariate analysis. The global attack and mortality rates were 488.9 cases/10,000 inhabitants and 6.24 deaths/10,000 inhabitants, respectively. Attack rates displayed a significantly high level of spatial heterogeneity (varying from 64.7 to 3070.9 per 10,000 inhabitants), thereby suggesting disparate outbreak processes. The epidemic course exhibited two principal outbreaks. The first outbreak (October 16, 2010-January 30, 2011) displayed a centrifugal spread of a damping wave that suddenly emerged from Mirebalais. The second outbreak began at the end of May 2011, concomitant with the onset of the rainy season, and displayed a highly fragmented epidemic pattern. Environmental factors (river and rice fields: p<0.003) played a role in disease dynamics exclusively during the early phases of the epidemic.
Conclusion: Our findings demonstrate that the epidemic is still evolving, with a changing transmission pattern as time passes. Such an evolution could have hardly been anticipated, especially in a country struck by cholera for the first time. These results argue for the need for control measures involving intense efforts in rapid and exhaustive case tracking.
Conflict of interest statement
The authors have declared that no competing interests exist.
Figures


Comment in
-
The Haiti cholera epidemic: from surveillance to action.Pathog Glob Health. 2014 Jan;108(1):3. doi: 10.1179/2047772413Z.000000000169. Pathog Glob Health. 2014. PMID: 24548154 Free PMC article. No abstract available.
Similar articles
-
High-resolution spatial analysis of cholera patients reported in Artibonite department, Haiti in 2010-2011.Epidemics. 2016 Mar;14:1-10. doi: 10.1016/j.epidem.2015.08.001. Epub 2015 Sep 3. Epidemics. 2016. PMID: 26972509
-
Mortality Rates during Cholera Epidemic, Haiti, 2010-2011.Emerg Infect Dis. 2016 Mar;22(3):410-6. doi: 10.3201/eid2203.141970. Emerg Infect Dis. 2016. PMID: 26886511 Free PMC article.
-
Understanding the cholera epidemic, Haiti.Emerg Infect Dis. 2011 Jul;17(7):1161-8. doi: 10.3201/eid1707.110059. Emerg Infect Dis. 2011. PMID: 21762567 Free PMC article.
-
Characterization of Interventional Studies of the Cholera Epidemic in Haiti.Prehosp Disaster Med. 2018 Apr;33(2):176-181. doi: 10.1017/S1049023X17007002. Epub 2018 Feb 19. Prehosp Disaster Med. 2018. PMID: 29455682 Review.
-
Widespread epidemic cholera caused by a restricted subset of Vibrio cholerae clones.Clin Microbiol Infect. 2014 May;20(5):373-9. doi: 10.1111/1469-0691.12610. Epub 2014 Mar 29. Clin Microbiol Infect. 2014. PMID: 24575898 Review.
Cited by
-
Changing patterns of spatial clustering of schistosomiasis in Southwest China between 1999-2001 and 2007-2008: assessing progress toward eradication after the World Bank Loan Project.Int J Environ Res Public Health. 2014 Jan 3;11(1):701-12. doi: 10.3390/ijerph110100701. Int J Environ Res Public Health. 2014. PMID: 24394217 Free PMC article.
-
Satellite-Derived, Smartphone-Delivered Geospatial Cholera Risk Information for Vulnerable Populations.Geohealth. 2024 Nov 9;8(11):e2024GH001039. doi: 10.1029/2024GH001039. eCollection 2024 Nov. Geohealth. 2024. PMID: 39524318 Free PMC article.
-
Interacting particle models on the impact of spatially heterogeneous human behavioral factors on dynamics of infectious diseases.PLoS Comput Biol. 2024 Aug 8;20(8):e1012345. doi: 10.1371/journal.pcbi.1012345. eCollection 2024 Aug. PLoS Comput Biol. 2024. PMID: 39116182 Free PMC article.
-
The dry season in haiti: a window of opportunity to eliminate cholera.PLoS Curr. 2013 Jun 10;5:ecurrents.outbreaks.2193a0ec4401d9526203af12e5024ddc. doi: 10.1371/currents.outbreaks.2193a0ec4401d9526203af12e5024ddc. PLoS Curr. 2013. PMID: 23873011 Free PMC article.
-
Geographic distribution and mortality risk factors during the cholera outbreak in a rural region of Haiti, 2010-2011.PLoS Negl Trop Dis. 2015 Mar 26;9(3):e0003605. doi: 10.1371/journal.pntd.0003605. eCollection 2015 Mar. PLoS Negl Trop Dis. 2015. PMID: 25811860 Free PMC article.
References
-
- Frerichs RR, Keim PS, Barrais R, Piarroux R (2012) Nepalese origin of cholera epidemic in Haiti. Clin Microbiol Infect 18: E158–E163. - PubMed
-
- Periago MR, Frieden TR, Tappero JW, De Cock KM, Aasen B, et al. (2012) Elimination of cholera transmission in Haiti and the Dominican Republic. Lancet 379: e12–13. - PubMed
Publication types
MeSH terms
LinkOut - more resources
Full Text Sources
Other Literature Sources
Medical

