

Redox-linked changes to the hydrogen-bonding network of ribonucleotide reductase β2
- PMID: 23594029
- PMCID: PMC3694779
- DOI: 10.1021/ja3032949
Redox-linked changes to the hydrogen-bonding network of ribonucleotide reductase β2
Abstract
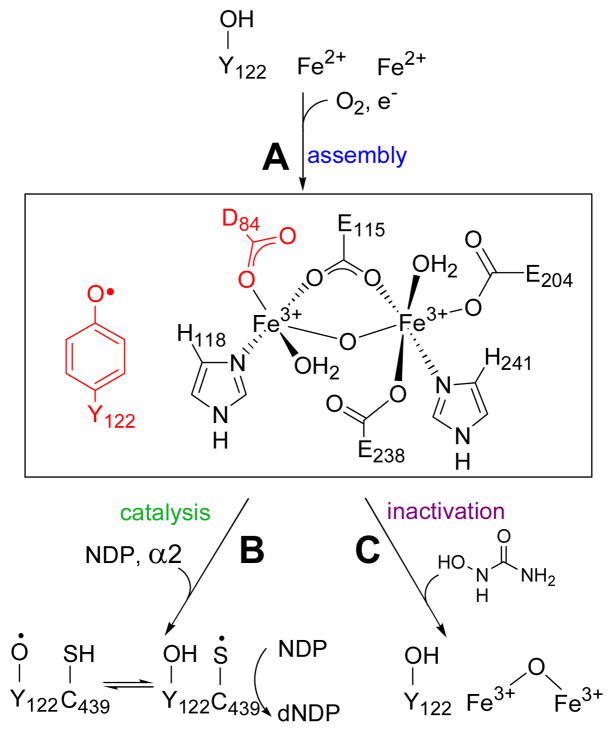
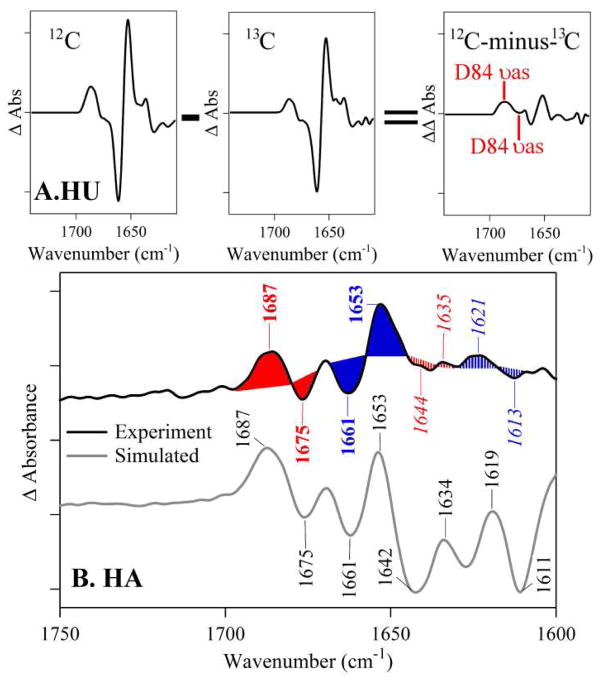
Ribonucleotide reductase (RNR) catalyzes conversion of nucleoside diphosphates (NDPs) to 2'-deoxynucleotides, a critical step in DNA replication and repair in all organisms. Class-Ia RNRs, found in aerobic bacteria and all eukaryotes, are a complex of two subunits: α2 and β2. The β2 subunit contains an essential diferric-tyrosyl radical (Y122O(•)) cofactor that is needed to initiate reduction of NDPs in the α2 subunit. In this work, we investigated the Y122O(•) reduction mechanism in Escherichia coli β2 by hydroxyurea (HU), a radical scavenger and cancer therapeutic agent. We tested the hypothesis that Y122OH redox reactions cause structural changes in the diferric cluster. Reduction of Y122O(•) was studied using reaction-induced FT-IR spectroscopy and [(13)C]aspartate-labeled β2. These Y122O(•) minus Y122OH difference spectra provide evidence that the Y122OH redox reaction is associated with a frequency change to the asymmetric vibration of D84, a unidentate ligand to the diferric cluster. The results are consistent with a redox-induced shift in H-bonding between Y122OH and D84 that may regulate proton-transfer reactions on the HU-mediated inactivation pathway in isolated β2.
Figures


Similar articles
-
Redox-dependent structural coupling between the α2 and β2 subunits in E. coli ribonucleotide reductase.J Phys Chem B. 2014 Mar 20;118(11):2993-3004. doi: 10.1021/jp501121d. Epub 2014 Mar 7. J Phys Chem B. 2014. PMID: 24606240
-
Redox-linked conformational control of proton-coupled electron transfer: Y122 in the ribonucleotide reductase β2 subunit.J Phys Chem B. 2013 Jul 18;117(28):8457-68. doi: 10.1021/jp404757r. Epub 2013 Jul 3. J Phys Chem B. 2013. PMID: 23822111 Free PMC article.
-
A Proton Wire Mediates Proton Coupled Electron Transfer from Hydroxyurea and Other Hydroxamic Acids to Tyrosyl Radical in Class Ia Ribonucleotide Reductase.J Phys Chem B. 2020 Jan 16;124(2):345-354. doi: 10.1021/acs.jpcb.9b08587. Epub 2020 Jan 6. J Phys Chem B. 2020. PMID: 31904962
-
The prototypic class Ia ribonucleotide reductase from Escherichia coli: still surprising after all these years.Biochem Soc Trans. 2012 Jun 1;40(3):523-30. doi: 10.1042/BST20120081. Biochem Soc Trans. 2012. PMID: 22616862 Free PMC article. Review.
-
Reaction dynamics and proton coupled electron transfer: studies of tyrosine-based charge transfer in natural and biomimetic systems.Biochim Biophys Acta. 2015 Jan;1847(1):46-54. doi: 10.1016/j.bbabio.2014.09.003. Epub 2014 Sep 28. Biochim Biophys Acta. 2015. PMID: 25260243 Review.
Cited by
-
A tyrosine-tryptophan dyad and radical-based charge transfer in a ribonucleotide reductase-inspired maquette.Nat Commun. 2015 Dec 2;6:10010. doi: 10.1038/ncomms10010. Nat Commun. 2015. PMID: 26627888 Free PMC article.
-
Iron and Chelation in Biochemistry and Medicine: New Approaches to Controlling Iron Metabolism and Treating Related Diseases.Cells. 2020 Jun 12;9(6):1456. doi: 10.3390/cells9061456. Cells. 2020. PMID: 32545424 Free PMC article. Review.
-
Biochemistry and theory of proton-coupled electron transfer.Chem Rev. 2014 Apr 9;114(7):3381-465. doi: 10.1021/cr4006654. Epub 2014 Apr 1. Chem Rev. 2014. PMID: 24684625 Free PMC article. Review. No abstract available.
-
Conformational control over proton-coupled electron transfer in metalloenzymes.Nat Rev Chem. 2024 Oct;8(10):762-775. doi: 10.1038/s41570-024-00646-7. Epub 2024 Sep 2. Nat Rev Chem. 2024. PMID: 39223400 Free PMC article. Review.
-
New Iron Metabolic Pathways and Chelation Targeting Strategies Affecting the Treatment of All Types and Stages of Cancer.Int J Mol Sci. 2022 Nov 13;23(22):13990. doi: 10.3390/ijms232213990. Int J Mol Sci. 2022. PMID: 36430469 Free PMC article. Review.
References
-
- Rardin RL, Tolman WB, Lippard SJ. New J Chem. 1991;15:417–430.
-
- Solomon EI, Brunold TC, Davis MI, Kemsley JN, Lee SK, Lehnert N, Neese F, Skulan AJ, Yang YS, Zhou J. Chem Rev. 2000;100:235–349. - PubMed
-
- Rofougaran R, Crona M, Vodnala M, Sjoberg BM, Hofer A. J Biol Chem. 2008;283:35310–35318. - PubMed
-
- Stubbe J, Nocera DG, Yee CS, Chang MCY. Chem Rev. 2003;103:2167–2201. - PubMed
Publication types
MeSH terms
Substances
Grants and funding
LinkOut - more resources
Full Text Sources
Other Literature Sources
