Comparative Study
. 2013 Apr 17;5(4):637-64.
doi: 10.3390/toxins5040637.

Multiple membrane interactions and versatile vesicle deformations elicited by melittin

Affiliations
Comparative Study

Multiple membrane interactions and versatile vesicle deformations elicited by melittin

Tomoyoshi Takahashi et al. Toxins (Basel). .

Abstract

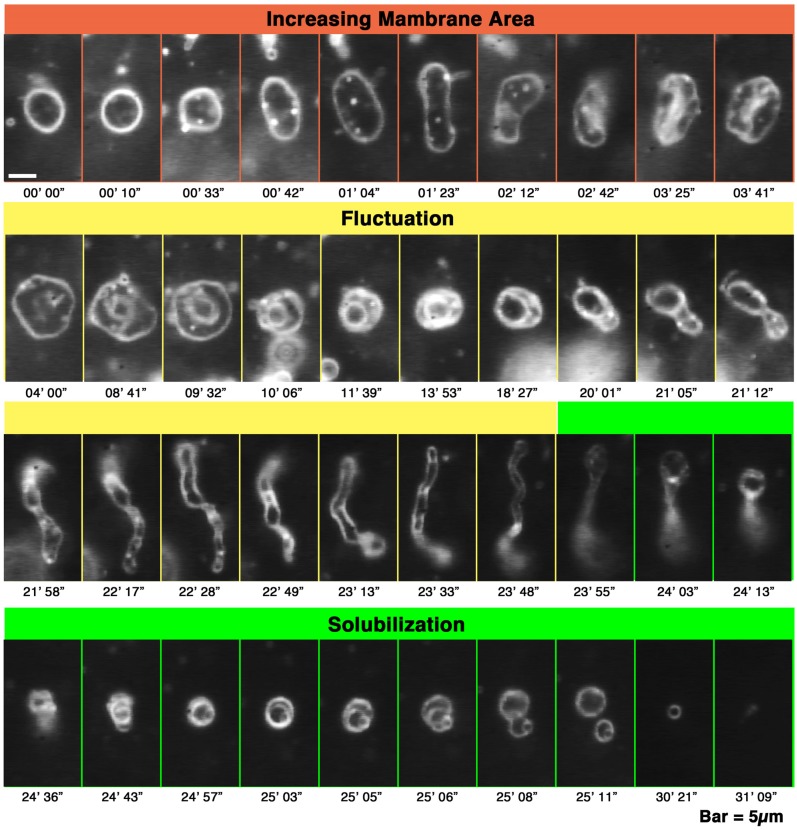
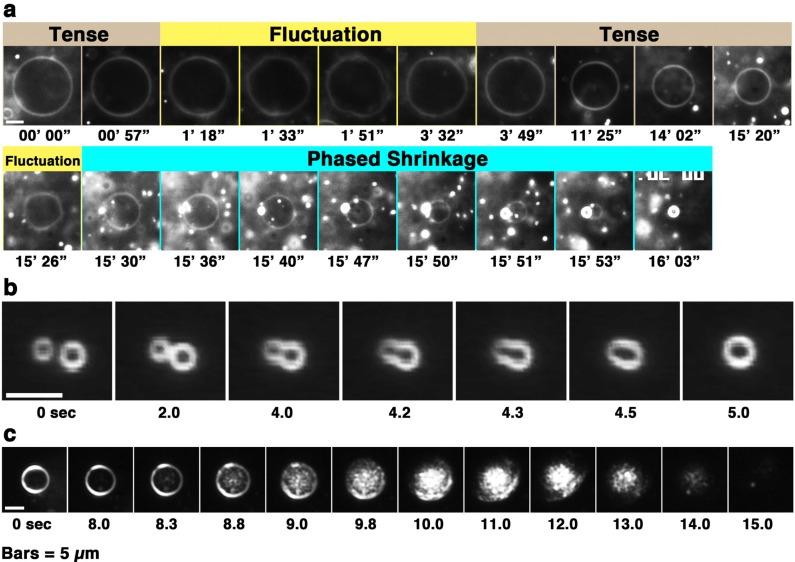
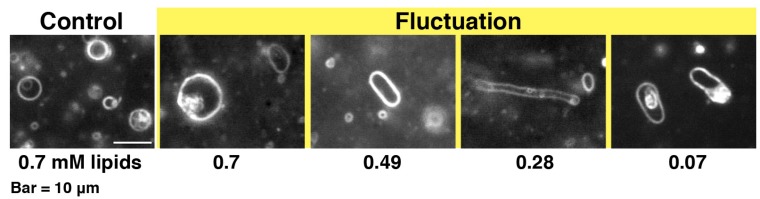
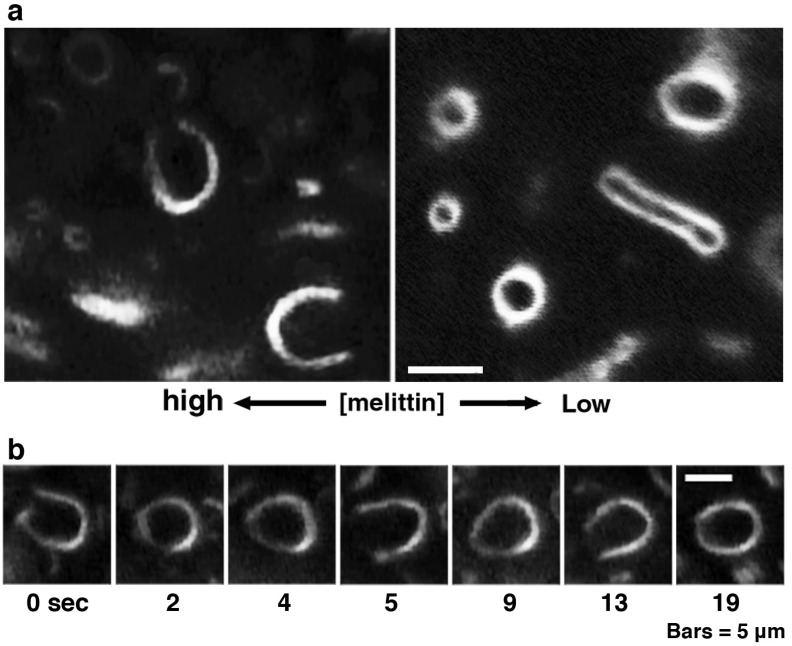
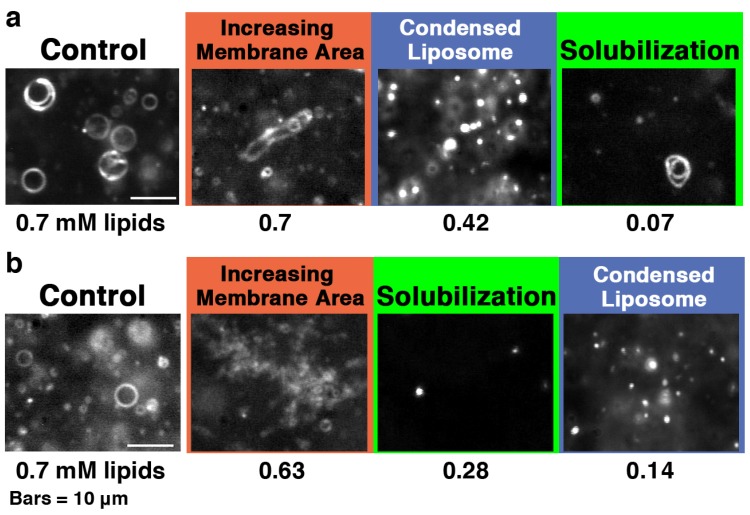
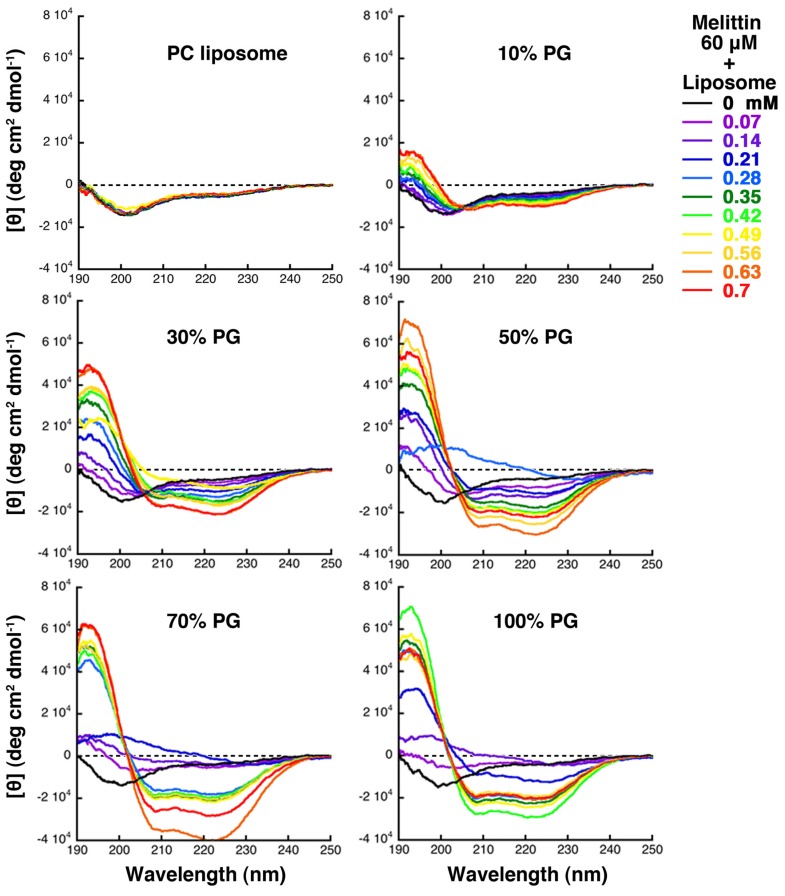
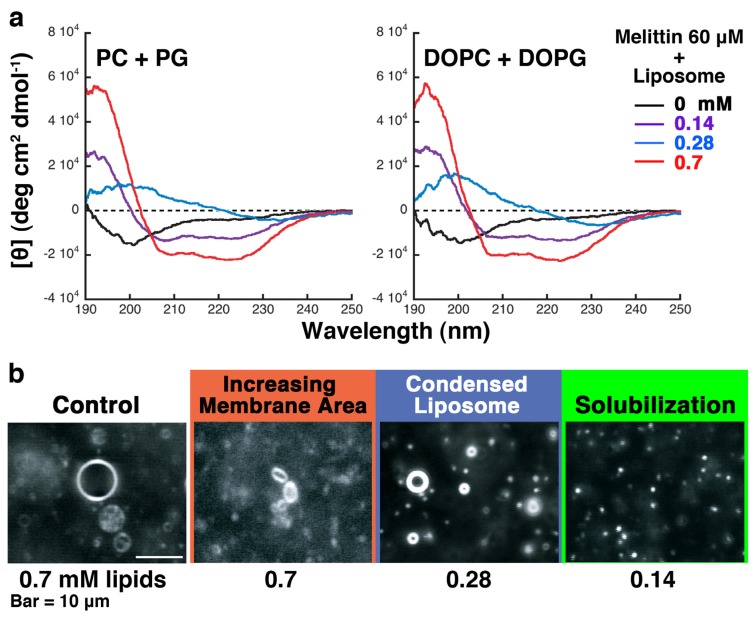
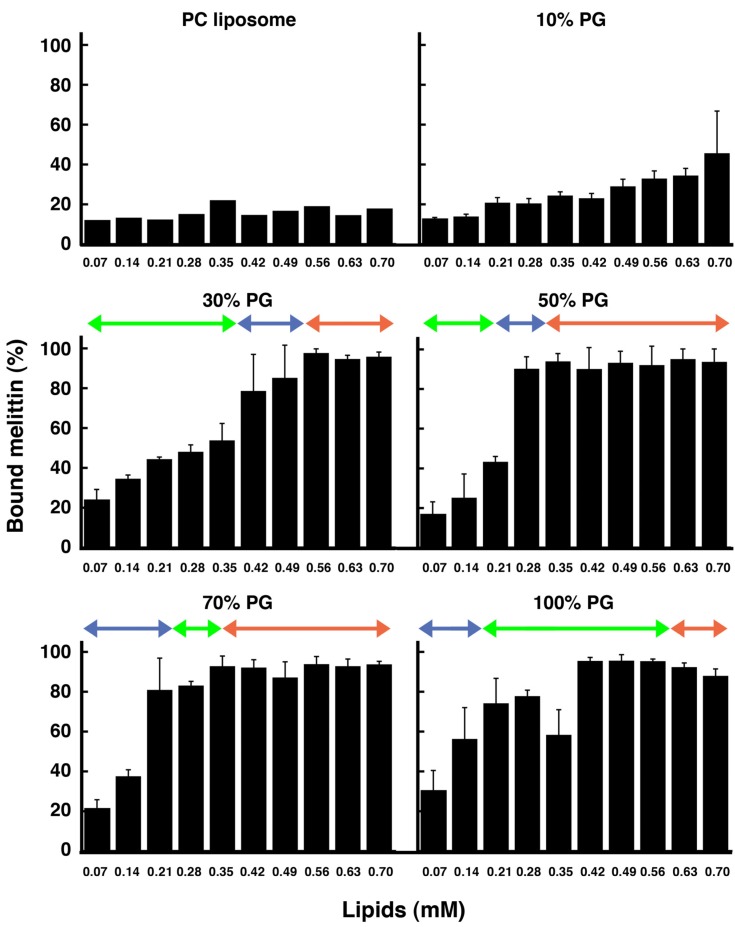
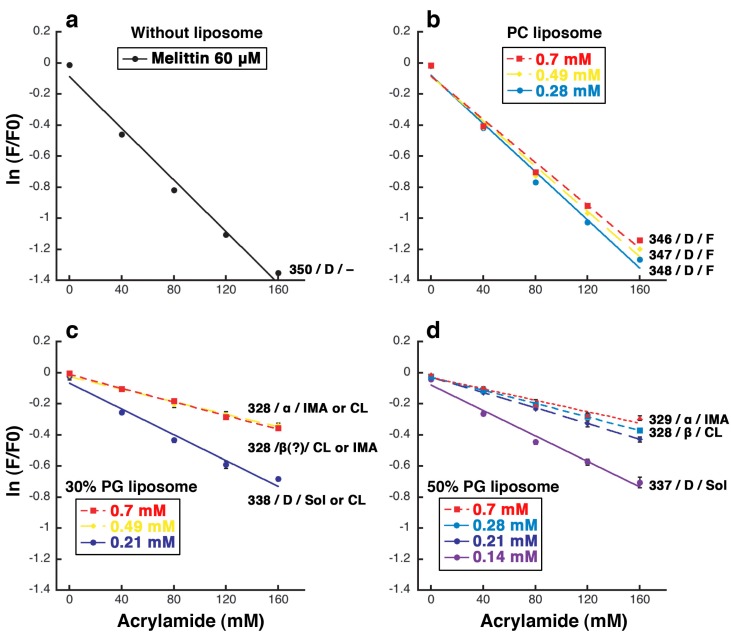
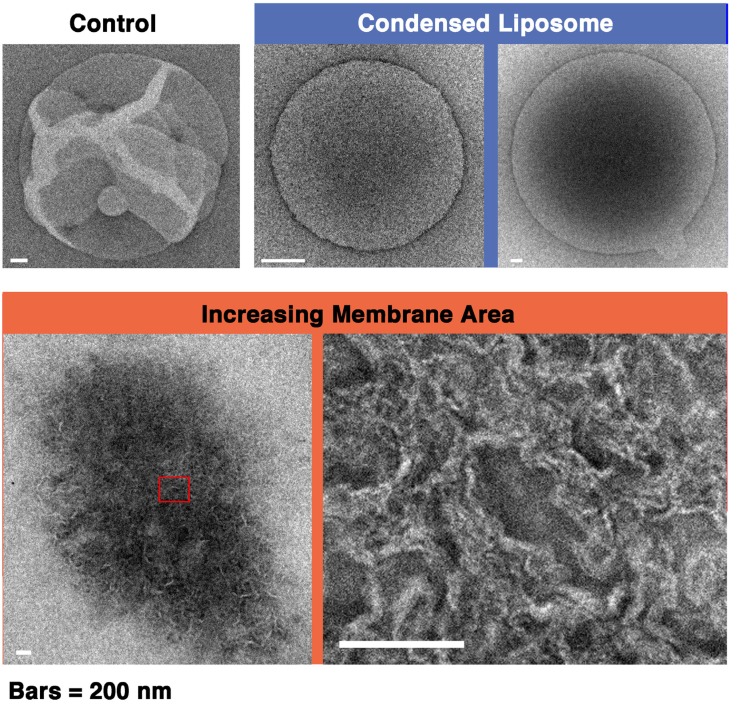
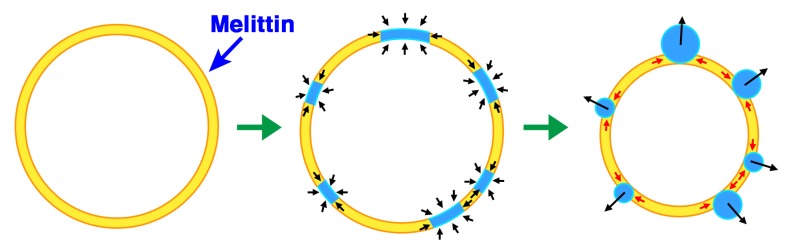
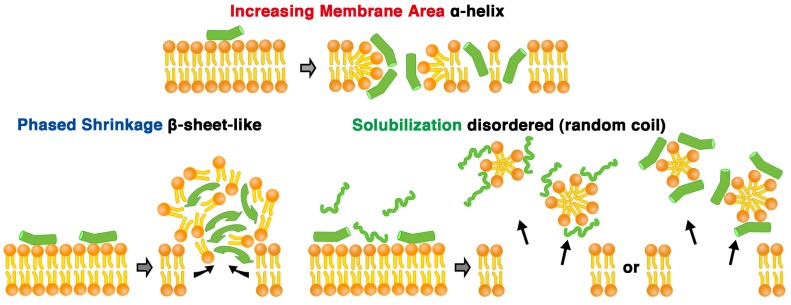
Melittin induces various reactions in membranes and has been widely studied as a model for membrane-interacting peptide; however, the mechanism whereby melittin elicits its effects remains unclear. Here, we observed melittin-induced changes in individual giant liposomes using direct real-time imaging by dark-field optical microscopy, and the mechanisms involved were correlated with results obtained using circular dichroism, cosedimentation, fluorescence quenching of tryptophan residues, and electron microscopy. Depending on the concentration of negatively charged phospholipids in the membrane and the molecular ratio between lipid and melittin, melittin induced the "increasing membrane area", "phased shrinkage", or "solubilization" of liposomes. In phased shrinkage, liposomes formed small particles on their surface and rapidly decreased in size. Under conditions in which the increasing membrane area, phased shrinkage, or solubilization were mainly observed, the secondary structure of melittin was primarily estimated as an α-helix, β-like, or disordered structure, respectively. When the increasing membrane area or phased shrinkage occurred, almost all melittin was bound to the membranes and reached more hydrophobic regions of the membranes than when solubilization occurred. These results indicate that the various effects of melittin result from its ability to adopt various structures and membrane-binding states depending on the conditions.


Figures

Figure 1
Figure 1
Deformation processes, increasing membrane area, fluctuation and solubilization of giant liposomes observed in a melittin concentration gradient. Time-lapse images of the deformation of PC liposomes perfused with melittin (final concentration 150 μM). The molecular ratio between melittin and the liposomes (P/L ratio), which is obtained using the ratio between the final concentrations of the peptide and lipids, is 1/4.7. The time after the start of observation is denoted in minutes and seconds under each dark-field image. The bar represents 5 μm. In figures showing the liposomal behaviors observed in a concentration gradient of melittin, the left side of each photograph is the direction in which the melittin concentration is higher.
Figure 2
Figure 2
(a) Phased shrinkage of giant liposomes observed in a melittin concentration gradient (see also supplementary film). The condensed liposome is the product of phased shrinkage deformation; (b) and (c) represent fusions between condensed liposomes and disassembly of a condensed liposome, respectively. Time-lapse images of 50% PG liposomes perfused with melittin (final concentration: 60 μM (the P/L ratio is 1/12)). The video camera sensitivity was decreased arbitrarily according to the increase in brightness of the liposome. The time after the start of observation is denoted in minutes and seconds (a) or as seconds (b and c) under each dark-field image. The bars represent 5 μm. In figures showing the liposomal behaviors observed in a concentration gradient of melittin, the left side of each photograph is the direction in which the melittin concentration is higher.
Figure 3
Figure 3
Dark-field images of 10% PG liposomes in the presence of melittin. The samples were prepared in the same way as those used for CD measurements. The final lipid concentration is denoted in mM under each dark-field image. The final melittin concentration was 60 μM (P/L = 1/12 to 1/1.2). The bar represents 10 μm.
Figure 4
Figure 4
Large pore formation of giant liposomes observed in a melittin concentration gradient. PC liposomes were perfused with 1 mM melittin (P/L = 1/1). (a) The regions in a microscopic specimen where the melittin concentrations are low (right) and high (left) are shown, respectively; (b) Time-lapse images of a liposome in which a large pore has opened are shown. The time after the start of observation is denoted in seconds under each dark-field image. The cup-like shape of the liposome was unstable, and repeated opening and closing of the pore was observed. The bars represent 5 μm. In figures showing the liposomal behaviors observed in a concentration gradient of melittin, the left side of each photograph is the direction in which the melittin concentration is higher.
Figure 5
Figure 5
Fusion between PC liposomes observed in the presence of high concentrations of melittin. PC liposomes were perfused with 1 mM melittin (P/L = 1/1). The time after the start of fusion is denoted in seconds under each dark-field image. The bar represents 5 μm. In figures showing the liposomal behaviors observed in a concentration gradient of melittin, the left side of each photograph is the direction in which the melittin concentration is higher.
Figure 6
Figure 6
Dark-field images of (a) 30 and (b) 100% PG liposomes in the presence of melittin. The samples were prepared in the same way as those used for CD measurements. The final lipid concentration is denoted in mM under each dark-field image. The final melittin concentration was 60 μM (P/L = 1/12 to 1/1.2). The bars represent 10 μm. The video camera sensitivity was decreased arbitrarily to observe condensed liposomes.
Figure 7
Figure 7
CD spectra of melittin (final concentration 60 μM) and giant liposome mixtures. The liposomes examined (PC, 10% PG, 30% PG, 50% PG, 70% PG or 100% PG liposomes) are indicated at the top of each panel. The final lipid concentration for each measurement is indicated by the color of line, as denoted on the right (P/L = 1/12 to 1/1.2).
Figure 8
Figure 8
(a) CD spectra obtained from mixtures of melittin (final concentration 60 μM) and 50% PG liposomes (left) or liposomes prepared from DOPC and DOPG (right). The lipid concentrations are indicated by the color of the lines, as denoted on the right; (b) Liposomes prepared from DOPC and DOPG in the presence of melittin; the conditions used are similar to those described in Figure 6. The bar represents 10 μm. The video camera sensitivity was decreased arbitrarily to observe condensed liposomes.
Figure 9
Figure 9
Fraction (%) of liposome-bound melittin. The final melittin concentration was 60 μM. The liposomes examined (PC, 10% PG, 30% PG, 50% PG, 70% PG or 100% PG liposomes) are indicated at the top of each panel. The experimental conditions were the same as those used for the CD measurements. Green, blue and red arrows in each panel show the ranges of concentration of total lipids where solubilization, phased shrinkage and increasing membrane area were mainly observed, respectively. Error bars indicate standard deviations.
Figure 10
Figure 10
Fluorescence quenching of tryptophan residue 19 of melittin by acrylamide. The results obtained with melittin alone (a) or mixed with PC (b), 30% PG (c), or 50% PG liposomes (d) are shown. The experimental conditions were the same as those used for the CD measurements. The final melittin concentration was 60 μM. The final lipid concentration is indicated by the color of line, as denoted in the box in each panel. The wavelength (nm) of the emission maximum, the estimated secondary structure of the majority of melittin and the typically observed liposome deformation are indicated at the side of each line. A disordered structure, an α-helix, and a β-like structure are denoted as “D”, “α”, and “β”, respectively. The fluctuation of liposome, increasing membrane area, condensed liposome formation, and solubilization are denoted as “F”, “IMA”, “CL”, and “Sol”, respectively.
Figure 11
Figure 11
A plot of the optimum molecular ratio of PG to melittin required to observe the formation of condensed liposomes against the content (%) of PG in the liposome membrane.
Figure 12
Figure 12
EM images of a liposome in the absence of melittin (control), condensed liposomes (two representatives shown here), and a liposome that has undergone increasing membrane area are shown. The bottom right image is an enlarged image of the boxed area on the bottom left. The bars represent 200 nm. To obtain condensed liposomes and liposomes that have undergone increasing membrane area, 50% PG liposomes (final concentrations 0.28 and 0.70 mM, respectively) were mixed with melittin (final concentration 60 μM (P/L ratios: 1/4.7 and 1/12, respectively)).
Figure 13
Figure 13
Model for phased shrinkage. The negatively charged phospholipid melittin binds to the membrane (left). The membrane-bound peptides form densely packed aggregates with the phospholipids, resulting in the droplet-like regions. The regions exhibit high brightness (center). The droplet-like regions are excluded from the surrounding lipid bilayer region by the membrane line tension. Concurrently, the droplet-like regions become spherical to reduce their surface area (right). As the result of repeating these processes, the liposome decreases in size to a small bright particle.
Figure 14
Figure 14
Schematic illustration of melittin-induced membrane deformation and the structure of melittin. The secondary structure of the majority of melittin was estimated as an α-helix, a β-like structure or a disordered structure under conditions where increasing membrane area, phased shrinkage or solubilization are mainly observed, respectively. At first, melittin binds to the surface of the membrane, possibly in parallel. Subsequently, with increasing concentrations of the peptide, melittin sequentially induces disassembly of the bilayer structure and solubilization of the liposome (bottom right), or penetrates into the membrane. The membrane-penetrating peptides increase membrane area (top). The membrane-binding or -penetrating peptides most likely interact with each other [44,56] and form pores (top) or form aggregates with phospholipids, causing the formation of condensed liposomes (bottom left). In the case of solubilization, two considerable cases (the secondary structure of melittin is a disordered or an α-helix) are illustrated.

References

    1. Dempsey C.E. The action of melittin on membranes. Biochem. Biophys. Acta. 1990;1031:143–161. doi: 10.1016/0304-4157(90)90006-X. - DOI - PubMed
    1. Habermann E. Bee and wasp venoms. Science. 1972;177:314–321. - PubMed
    1. DeGrado W.F., Musso F., Lieber M., Kaiser E.T., Kezdy F.J. Kinetics and mechanism of hemolysis induced by melittin and by a synthetic melittin analogue. Biophys. J. 1982;37:329–338. doi: 10.1016/S0006-3495(82)84681-X. - DOI - PMC - PubMed
    1. Hider R.C., Khader F., Tatham A.S. Lytic activity of monomeric and oligomeric melittin. Biochim. Biophys. Acta. 1983;728:206–214. doi: 10.1016/0005-2736(83)90473-X. - DOI - PubMed
    1. Raghuraman H., Chattopadhyay A. Melittin: A membrane-active peptide with diverse functions. Biosci. Rep. 2007;27:189–223. doi: 10.1007/s10540-006-9030-z. - DOI - PubMed

Publication types

MeSH terms

LinkOut - more resources