. 2012;74(3-4):118-28.
doi: 10.1159/000346826. Epub 2013 Apr 11.

Population genetics of rare variants and complex diseases

Affiliations

Population genetics of rare variants and complex diseases

M Cyrus Maher et al. Hum Hered. 2012.

Abstract

Objectives: Identifying drivers of complex traits from the noisy signals of genetic variation obtained from high-throughput genome sequencing technologies is a central challenge faced by human geneticists today. We hypothesize that the variants involved in complex diseases are likely to exhibit non-neutral evolutionary signatures. Uncovering the evolutionary history of all variants is therefore of intrinsic interest for complex disease research. However, doing so necessitates the simultaneous elucidation of the targets of natural selection and population-specific demographic history.

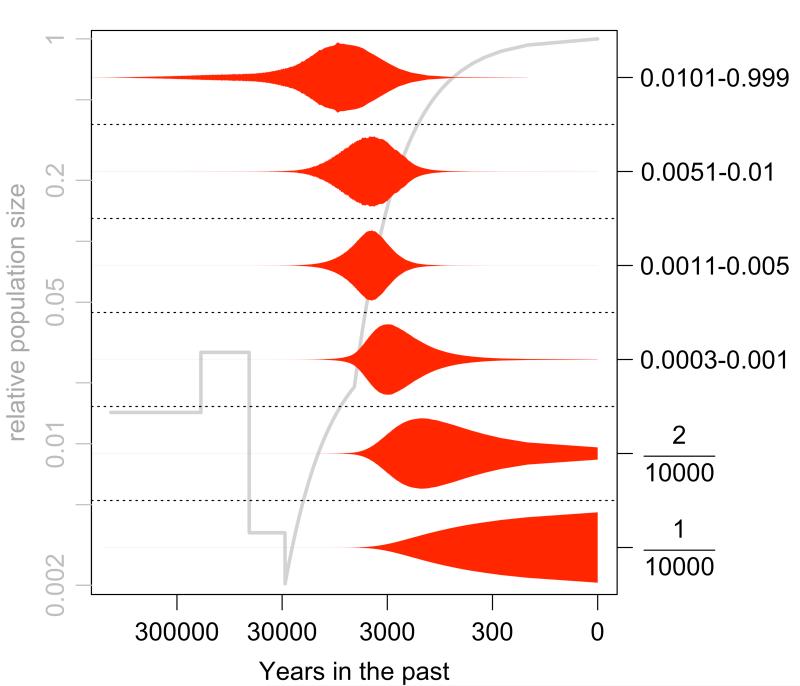
Methods: Here we characterize the action of natural selection operating across complex disease categories, and use population genetic simulations to evaluate the expected patterns of genetic variation in large samples. We focus on populations that have experienced historical bottlenecks followed by explosive growth (consistent with many human populations), and describe the differences between evolutionarily deleterious mutations and those that are neutral.

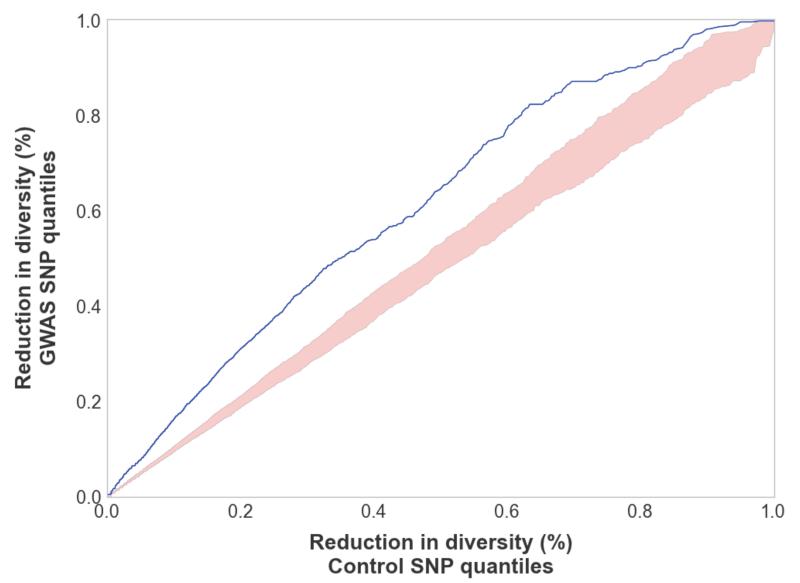
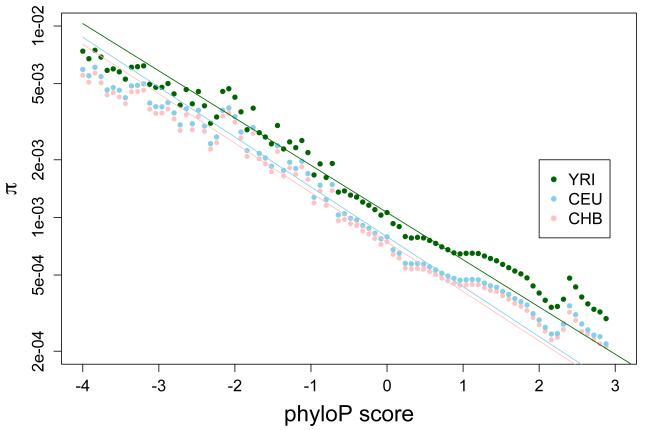
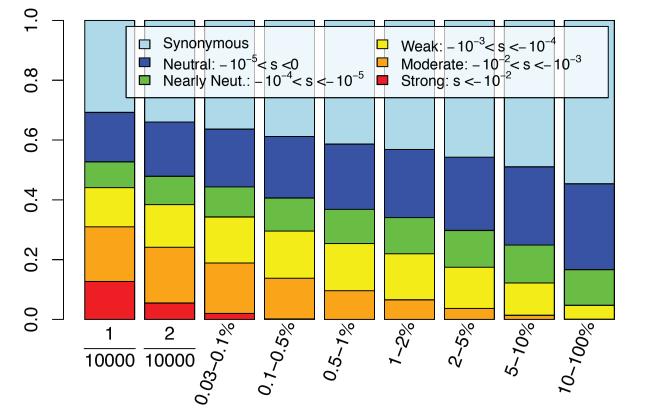
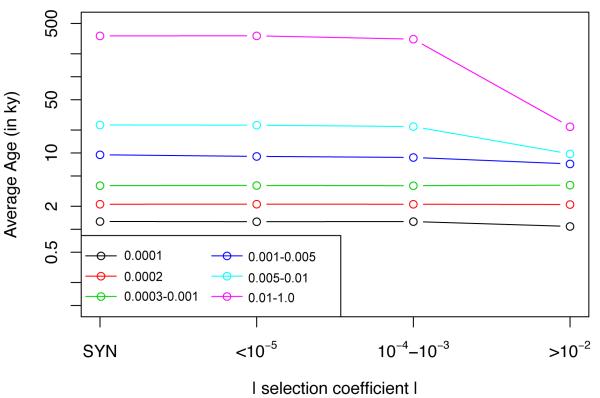
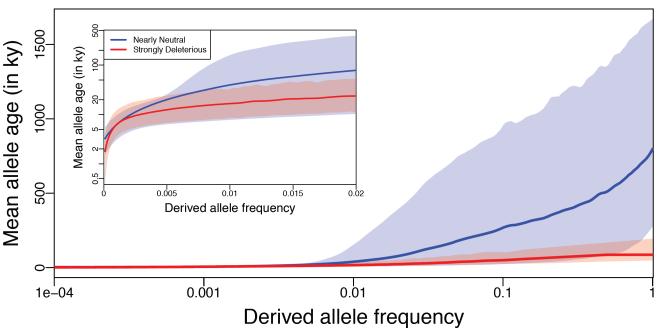
Results: Genes associated with several complex disease categories exhibit stronger signatures of purifying selection than non-disease genes. In addition, loci identified through genome-wide association studies of complex traits also exhibit signatures consistent with being in regions recurrently targeted by purifying selection. Through simulations, we show that population bottlenecks and rapid growth enable deleterious rare variants to persist at low frequencies just as long as neutral variants, but low-frequency and common variants tend to be much younger than neutral variants. This has resulted in a large proportion of modern-day rare alleles that have a deleterious effect on function and that potentially contribute to disease susceptibility.

Conclusions: The key question for sequencing-based association studies of complex traits is how to distinguish between deleterious and benign genetic variation. We used population genetic simulations to uncover patterns of genetic variation that distinguish these two categories, especially derived allele age, thereby providing inroads into novel methods for characterizing rare genetic variation driving complex diseases.


Figures

Figure 1
Figure 1
GWAS SNPs for complex traits are significantly more impacted by background selection than are control SNPs in HapMap (41) (chosen to match the frequency and genetic distance to closest gene of GWAS SNPs). In blue is a QQ-plot comparing the background selection scores for GWAS quantiles versus the background selection score for control SNPs. In pink is the entire range of background scores for each quantile across 1000 independently drawn control sets.
Figure 2
Figure 2
There is a strong log-linear correlation between genetic diversity within three human populations [π; (7)] and long-term evolutionary conservation across species [phyloP (42)]. Regression lines for each population have been fit to the subset of data considered neutral (phyloP between −1.2 and 1.2), and extrapolated to the range of data observed across the genome.
Figure 3
Figure 3
The distribution of selection coefficients for variants in each allele frequency bin (starting with singletons, doubletons, and then a disjoint partition of rare and common variants). Common variants (>5%) are expected to be primarily neutral or nearly-neutral. Most strongly deleterious mutations are <0.1% frequency.
Figure 4
Figure 4
Simulations demonstrate that the patterns of genetic variation of European populations have been shaped by a complex demographic history and distribution of deleterious selective effects. This violin plot shows the distribution of ages of non-synonymous mutations for each allele frequency bin (right axis, including singletons and doubletons, followed by a partitioning of rare variant frequencies), overlaid on top of a model of European demographic history (9)(grey, with relative population size on left axis).
Figure 5
Figure 5
The average age of mutations in various frequency bins, partitioned into synonymous variants, neutral non-synonymous variants (∣s∣<10−5), weakly deleterious variants (10−4<∣s∣<10−3), and strongly deleterious variants (∣s∣>10−2).
Figure 6
Figure 6
Deleterious alleles are younger on average than neutral alleles at the same frequency. Solid curves represent mean age of alleles at each frequency for non-synonymous variants that are neutral (blue) and strongly deleterious (red). The pink and blue envelopes show the 90%-quantile range of ages for all variants observed at each frequency. Inset is a zoom into the low frequency range showing the increased variance in age for neutral variants at frequency >0.5%. Variants at higher frequencies have been pooled such that the mean and 90%-quantile range are based on at least 200 variants. Curves are smoothed with loess using a span of 0.1.

Similar articles

Cited by

References

    1. Kong A, et al. Nature. 2012;488:471. - PMC - PubMed
    1. Nachman MW, Crowell SL. Genetics. 2000;156:297. - PMC - PubMed
    1. Roach JC, et al. Science. 2010;328:636. - PMC - PubMed
    1. Hernandez RD, et al. Science. 2011;331:920. - PMC - PubMed
    1. Charlesworth B, Morgan MT, Charlesworth D. Genetics. 1993;134:1289. - PMC - PubMed

Publication types