

Isoform level expression profiles provide better cancer signatures than gene level expression profiles
- PMID: 23594586
- PMCID: PMC3706752
- DOI: 10.1186/gm437
Isoform level expression profiles provide better cancer signatures than gene level expression profiles
Abstract
Background: The majority of mammalian genes generate multiple transcript variants and protein isoforms through alternative transcription and/or alternative splicing, and the dynamic changes at the transcript/isoform level between non-oncogenic and cancer cells remain largely unexplored. We hypothesized that isoform level expression profiles would be better than gene level expression profiles at discriminating between non-oncogenic and cancer cellsgene level.
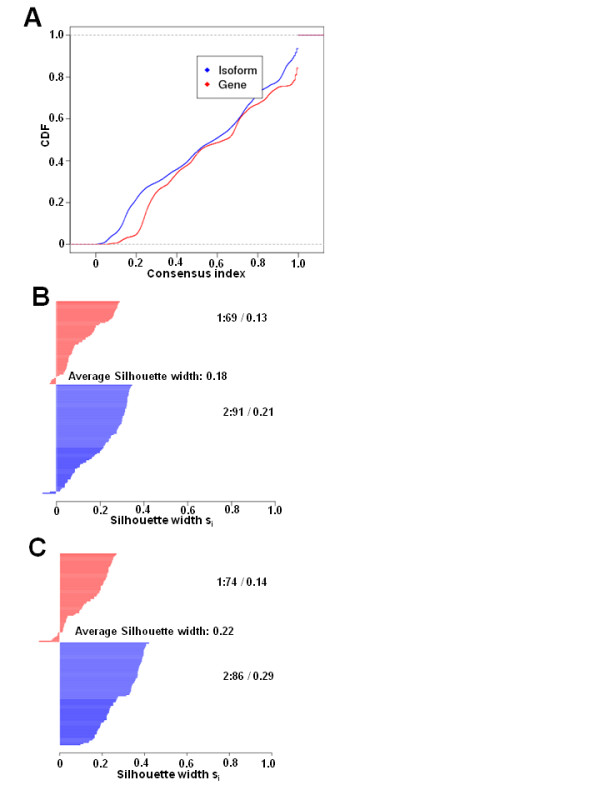
Methods: We analyzed 160 Affymetrix exon-array datasets, comprising cell lines of non-oncogenic or oncogenic tissue origins. We obtained the transcript-level and gene level expression estimates, and used unsupervised and supervised clustering algorithms to study the profile similarity between the samples at both gene and isoform levels.
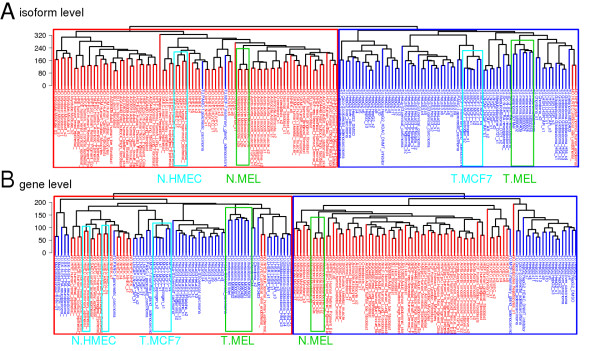
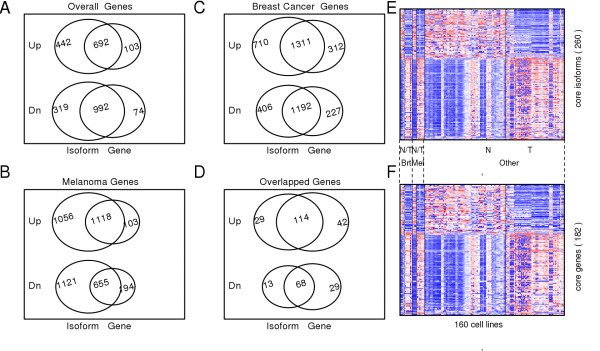
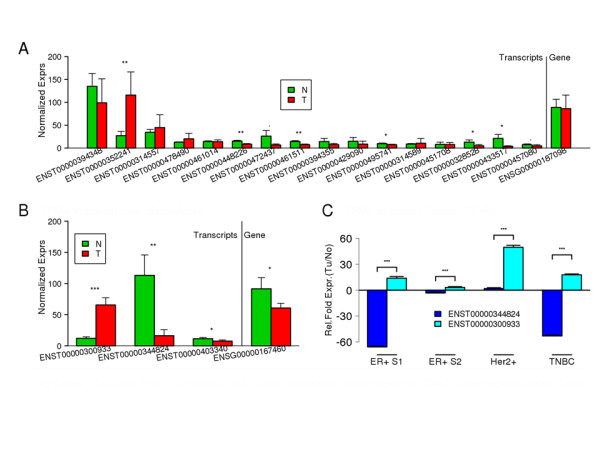
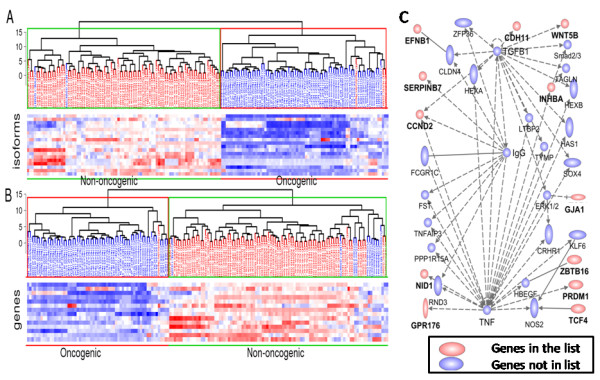
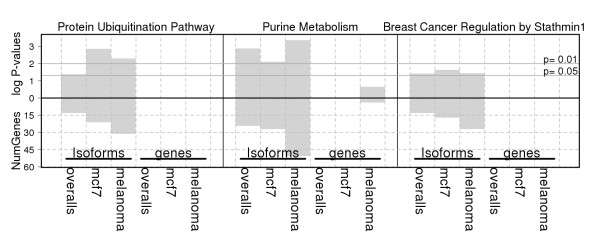
Results: Hierarchical clustering, based on isoform level expressions, effectively grouped the non-oncogenic and oncogenic cell lines with a virtually perfect homogeneity-grouping rate (97.5%), regardless of the tissue origin of the cell lines. However, gene levelthis rate was much lower, being 75% at best based on the gene level expressions. Statistical analyses of the difference between cancer and non-oncogenic samples identified the existence of numerous genes with differentially expressed isoforms, which otherwise were not significant at the gene level. We also found that canonical pathways of protein ubiquitination, purine metabolism, and breast-cancer regulation by stathmin1 were significantly enriched among genes thatshow differential expression at isoform level but not at gene level.
Conclusions: In summary, cancer cell lines, regardless of their tissue of origin, can be effectively discriminated from non-cancer cell lines at isoform level, but not at gene level. This study suggests the existence of an isoform signature, rather than a gene signature, which could be used to distinguish cancer cells from normal cells.
Figures
Similar articles
-
Comparative evaluation of isoform-level gene expression estimation algorithms for RNA-seq and exon-array platforms.Brief Bioinform. 2017 Mar 1;18(2):260-269. doi: 10.1093/bib/bbw016. Brief Bioinform. 2017. PMID: 26944083 Free PMC article.
-
Comparison of Affymetrix Gene Array with the Exon Array shows potential application for detection of transcript isoform variation.BMC Genomics. 2009 Nov 12;10:519. doi: 10.1186/1471-2164-10-519. BMC Genomics. 2009. PMID: 19909511 Free PMC article.
-
Characterization of kinase gene expression and splicing profile in prostate cancer with RNA-Seq data.BMC Genomics. 2018 Aug 13;19(Suppl 6):564. doi: 10.1186/s12864-018-4925-1. BMC Genomics. 2018. PMID: 30367578 Free PMC article.
-
Alternative transcription and alternative splicing in cancer.Pharmacol Ther. 2012 Dec;136(3):283-94. doi: 10.1016/j.pharmthera.2012.08.005. Epub 2012 Aug 14. Pharmacol Ther. 2012. PMID: 22909788 Review.
-
From General Aberrant Alternative Splicing in Cancers and Its Therapeutic Application to the Discovery of an Oncogenic DMTF1 Isoform.Int J Mol Sci. 2017 Mar 2;18(3):191. doi: 10.3390/ijms18030191. Int J Mol Sci. 2017. PMID: 28257090 Free PMC article. Review.
Cited by
-
Biological classification with RNA-seq data: Can alternatively spliced transcript expression enhance machine learning classifiers?RNA. 2018 Sep;24(9):1119-1132. doi: 10.1261/rna.062802.117. Epub 2018 Jun 25. RNA. 2018. PMID: 29941426 Free PMC article.
-
Overexpressed long noncoding RNA CRNDE with distinct alternatively spliced isoforms in multiple cancers.Front Med. 2019 Jun;13(3):330-343. doi: 10.1007/s11684-017-0557-0. Epub 2019 Jun 11. Front Med. 2019. PMID: 29808251
-
Exploring lncRNAs associated with human pancreatic islet cell death induced by transfer of adoptive lymphocytes in a humanized mouse model.Front Endocrinol (Lausanne). 2023 Nov 1;14:1244688. doi: 10.3389/fendo.2023.1244688. eCollection 2023. Front Endocrinol (Lausanne). 2023. PMID: 38027148 Free PMC article.
-
Genomic sites hypersensitive to ultraviolet radiation.Proc Natl Acad Sci U S A. 2019 Nov 26;116(48):24196-24205. doi: 10.1073/pnas.1907860116. Epub 2019 Nov 13. Proc Natl Acad Sci U S A. 2019. PMID: 31723047 Free PMC article.
-
OMICfpp: a fuzzy approach for paired RNA-Seq counts.BMC Genomics. 2019 Apr 2;20(1):259. doi: 10.1186/s12864-019-5496-5. BMC Genomics. 2019. PMID: 30940089 Free PMC article.
References
LinkOut - more resources
Full Text Sources
Other Literature Sources
