

Motor vehicle traffic-related pedestrian deaths - United States, 2001-2010
- PMID: 23594683
- PMCID: PMC4604973
Motor vehicle traffic-related pedestrian deaths - United States, 2001-2010
Abstract
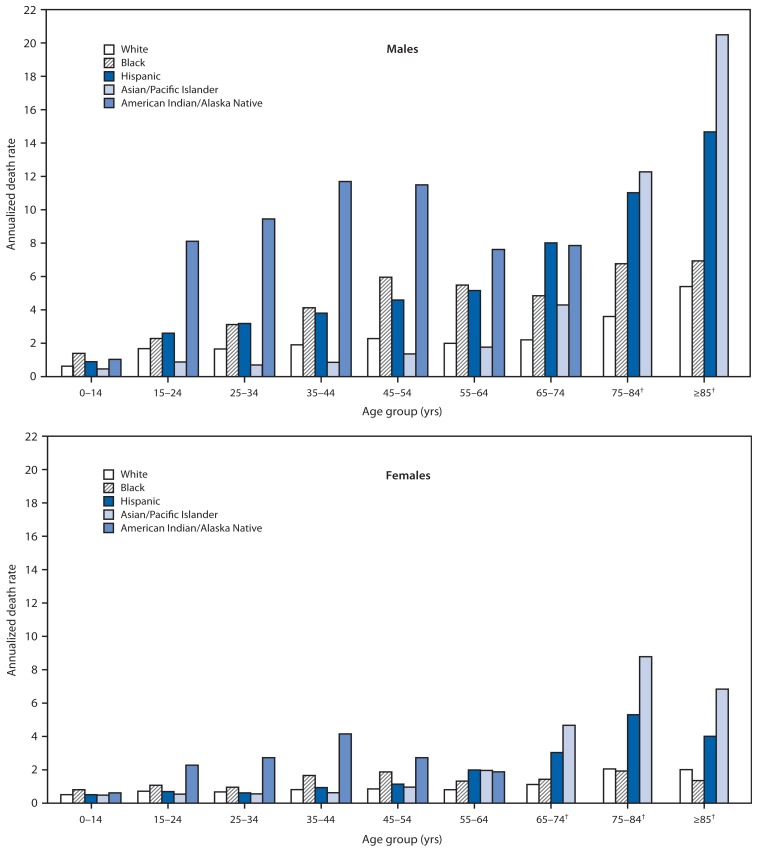
Motor vehicle traffic crashes are the leading cause of unintentional injury-related death in the United States, resulting in 33,687 deaths in 2010. Pedestrian travel makes up 10.5% of all trips (i.e., any travel from one address to another) taken in the United States, and pedestrians represent 13% of all motor vehicle traffic-related deaths. To determine traffic-related pedestrian death rates by sex, age group, race/ethnicity, and urbanization level, CDC analyzed 2001-2010 data from the National Vital Statistics System (NVSS). The results of that analysis indicated that the overall, annualized, age-adjusted traffic-related pedestrian death rate was 1.58 deaths per 100,000 population. Persons aged ≥75 years and those categorized as American Indian/Alaska Native (AI/AN) had the highest death rates, and age group differences varied by race/ethnicity. The results suggest that the overall pedestrian death rate could increase with the aging and growing racial/ethnic diversity of the U.S. population. The U.S. Census Bureau projects that the number of persons aged ≥75 years will more than double, from approximately 18 million in 2011 (6% of the U.S. population) to 44 million in 2040 (12% of the population); minority racial/ethnic populations are projected to increase from 116 million in 2010 (37% of the population) to 186 million in 2040 (49% of the population).* Strategies to prevent pedestrian deaths should include consideration of the needs of older adults and cultural differences among racial/ethnic populations.
Figures
Similar articles
-
Pedestrian traffic deaths among residents, visitors, and homeless persons--Clark County, Nevada, 2008-2011.MMWR Morb Mortal Wkly Rep. 2014 Jul 18;63(28):597-602. MMWR Morb Mortal Wkly Rep. 2014. PMID: 25029111 Free PMC article.
-
Why more male pedestrians die in vehicle-pedestrian collisions than female pedestrians: a decompositional analysis.Inj Prev. 2013 Aug;19(4):227-31. doi: 10.1136/injuryprev-2012-040594. Epub 2012 Nov 29. Inj Prev. 2013. PMID: 23197672 Free PMC article.
-
Motor vehicle crash pedestrian deaths in New York City: the plight of the older pedestrian.Inj Prev. 2006 Dec;12(6):414-6. doi: 10.1136/ip.2005.010082. Inj Prev. 2006. PMID: 17170193 Free PMC article.
-
Preventing pediatric pedestrian injuries.J Trauma. 2009 May;66(5):1492-9. doi: 10.1097/TA.0b013e31819d9c9b. J Trauma. 2009. PMID: 19430259 Review.
-
Pediatric pedestrian injuries: emergency care considerations.Pediatr Emerg Care. 2007 Oct;23(10):738-44. doi: 10.1097/PEC.0b013e318156acea. Pediatr Emerg Care. 2007. PMID: 18090111 Review.
Cited by
-
The Impact of a Signalized Crosswalk on Traffic Speed and Street-Crossing Behaviors of Residents in an Underserved Neighborhood.J Urban Health. 2015 Oct;92(5):910-22. doi: 10.1007/s11524-015-9979-7. J Urban Health. 2015. PMID: 26354602 Free PMC article.
-
Development of a Screening and Brief Intervention Process for Symptoms of Psychological Trauma Among Primary Care Patients of Two American Indian and Alaska Native Health Systems.J Behav Health Serv Res. 2017 Apr;44(2):224-241. doi: 10.1007/s11414-016-9519-6. J Behav Health Serv Res. 2017. PMID: 27328846 Free PMC article.
-
Impacts of alcohol availability on Tribal lands where alcohol is prohibited: A community-partnered qualitative investigation.Int J Drug Policy. 2018 Apr;54:77-86. doi: 10.1016/j.drugpo.2018.01.010. Epub 2018 Feb 8. Int J Drug Policy. 2018. PMID: 29414489 Free PMC article.
-
Pedestrian traffic deaths among residents, visitors, and homeless persons--Clark County, Nevada, 2008-2011.MMWR Morb Mortal Wkly Rep. 2014 Jul 18;63(28):597-602. MMWR Morb Mortal Wkly Rep. 2014. PMID: 25029111 Free PMC article.
-
Disparities in road crash mortality among pedestrians using wheelchairs in the USA: results of a capture-recapture analysis.BMJ Open. 2015 Nov 20;5(11):e008396. doi: 10.1136/bmjopen-2015-008396. BMJ Open. 2015. PMID: 26589426 Free PMC article.
References
-
- CDC. Web-based Injury Statistics Query and Reporting System (WISQARS) Atlanta, GA: US Department of Health and Human Services, CDC; 2013. Available at http://www.cdc.gov/injury/wisqars/index.html.
-
- National Highway Traffic Safety Administration. Traffic safety facts, 2010 data: pedestrians. Washington, DC: National Highway Traffic Safety Administration; 2012. Available at http://www-nrd.nhtsa.dot.gov/pubs/811625.pdf.
-
- National Highway Traffic Safety Administration. National pedestrian crash report. Washington, DC: National Highway Traffic Safety Administration; 2008. Available at http://www-nrd.nhtsa.dot.gov/pubs/810968.pdf.
MeSH terms
LinkOut - more resources
Full Text Sources
Medical
