. 2013 May 2;497(7447):74-9.
doi: 10.1038/nature12112. Epub 2013 Apr 17.

Hippocampal place-cell sequences depict future paths to remembered goals

Affiliations

Hippocampal place-cell sequences depict future paths to remembered goals

Brad E Pfeiffer et al. Nature. .

Abstract

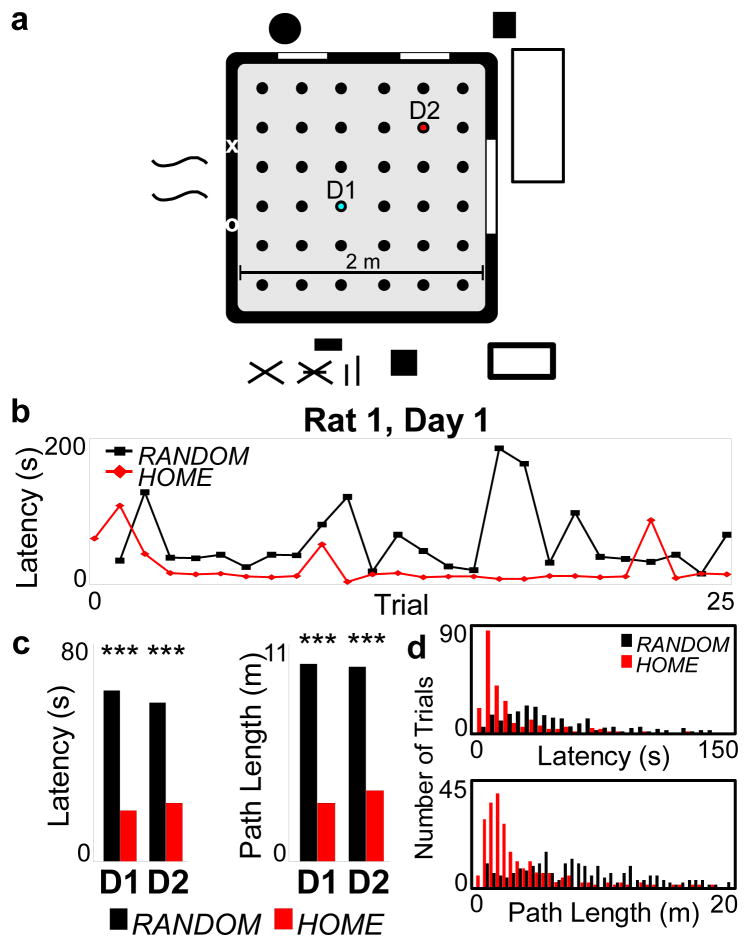
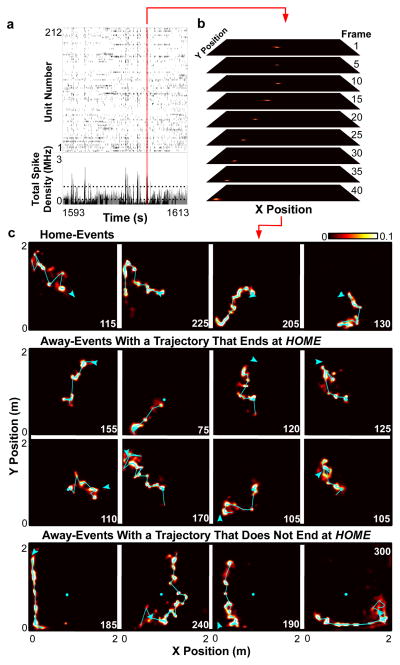
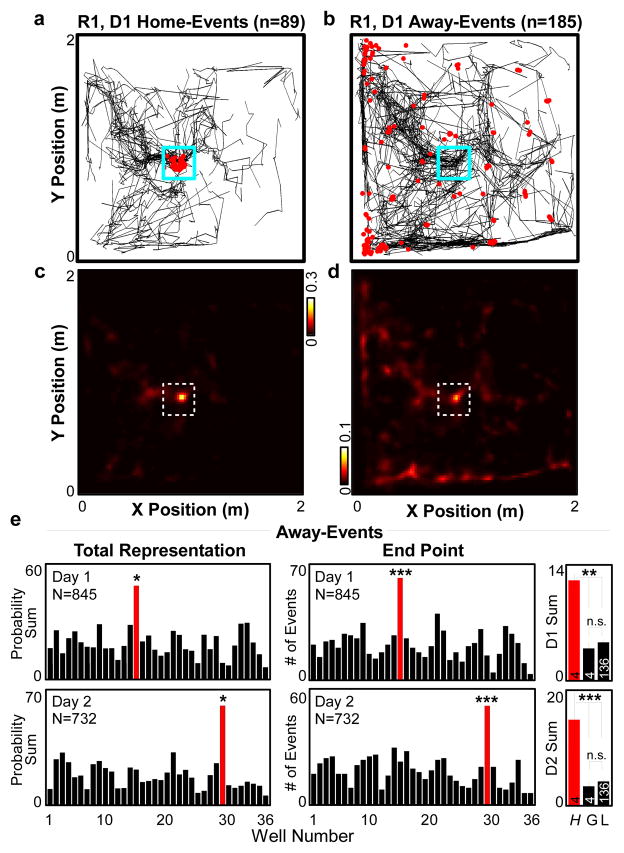
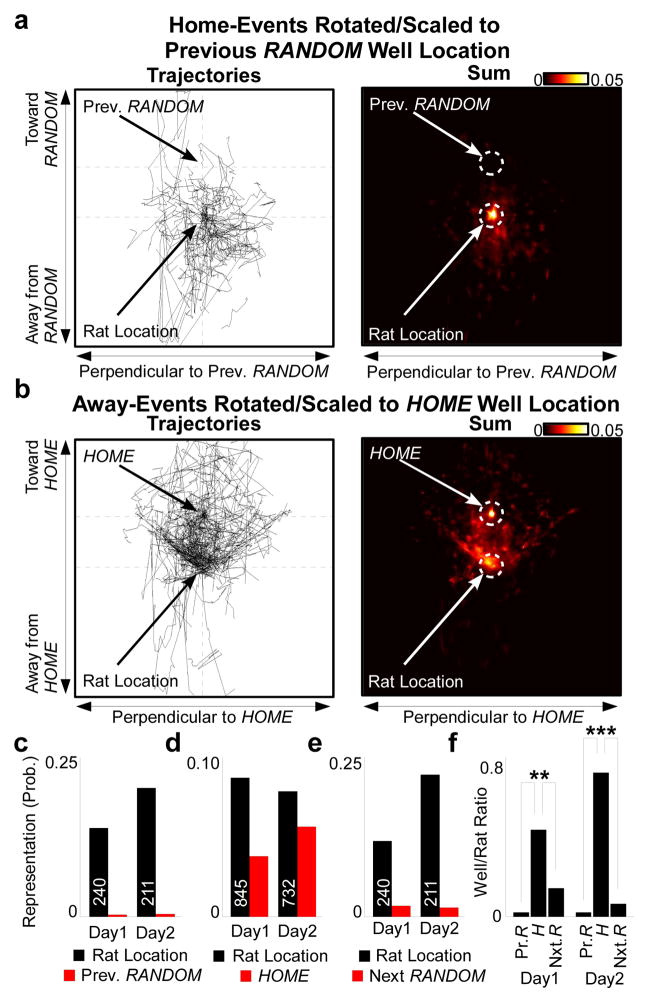
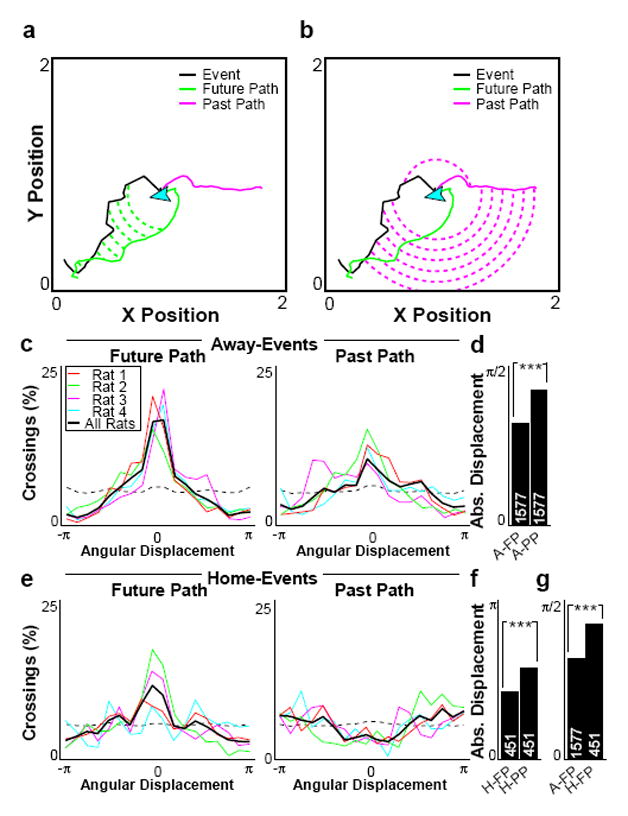
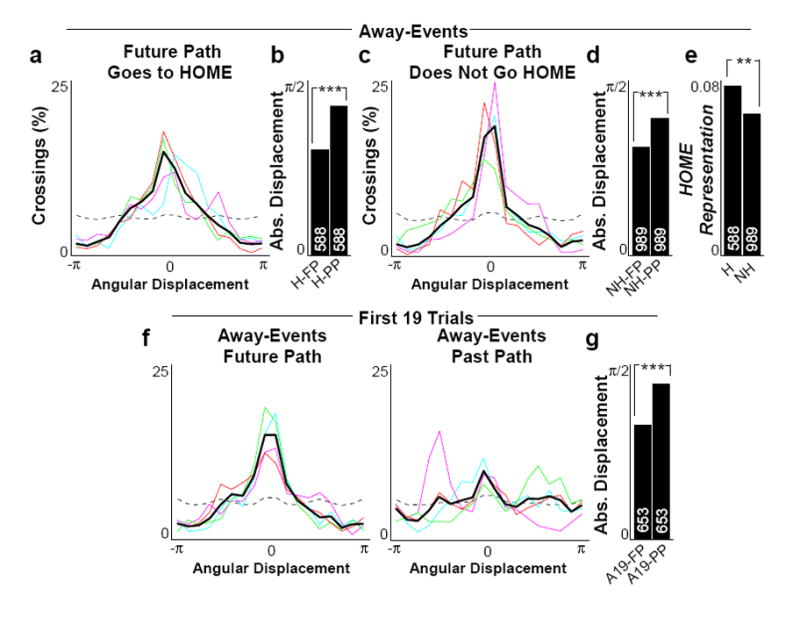
Effective navigation requires planning extended routes to remembered goal locations. Hippocampal place cells have been proposed to have a role in navigational planning, but direct evidence has been lacking. Here we show that before goal-directed navigation in an open arena, the rat hippocampus generates brief sequences encoding spatial trajectories strongly biased to progress from the subject's current location to a known goal location. These sequences predict immediate future behaviour, even in cases in which the specific combination of start and goal locations is novel. These results indicate that hippocampal sequence events characterized previously in linearly constrained environments as 'replay' are also capable of supporting a goal-directed, trajectory-finding mechanism, which identifies important places and relevant behavioural paths, at specific times when memory retrieval is required, and in a manner that could be used to control subsequent navigational behaviour.


Figures

Figure 1
Figure 1. Behavior in the open-field spatial memory task
a, Schema of arena and room, reward wells (circles), and HOME location for days 1 and 2 (D1, cyan; D2, red). b, Per-trial latency to reach HOME or RANDOM well location for rat 1 (R1) on D1. c, Mean latency and path length to reach HOME or RANDOM well location across all rats for D1 and D2. P-values (Wilcoxon rank sum test): Latency D1 5.5x10⁻¹⁹, D2 9.7x10⁻¹⁴; Path D1 2.7x10⁻¹⁹, D2 5.2x10⁻¹⁶. d, Histogram of latencies (5 s bins) and path lengths (50 cm bins) for all trials (shown to 150s and 20m respectively) P-values (Kolmogorov-Smirnov test): Latency 2.6x10⁻²; Path 9.1x10⁻⁴.
Figure 2
Figure 2. Trajectory events
a, Raster plot (top) and spike density (bottom) of simultaneous unit activity for R1,D1 for representative epoch. Periods of immobility denoted in black. Dashed lines represent candidate event detection threshold. b, Position posterior probabilities in selected frames for the candidate event in a. c, 16 representative events (of 274) for R1,D1, decoded and summed across time. Values indicated by colorbar. Event duration (in ms) in right corner. Cyan circle: HOME well. Cyan line: peak probability for each timeframe. Cyan arrowhead: position and head direction of rat at time of event. Videos of each event available in online SupplementaryVideo 2.
Figure 3
Figure 3. Remote representation of goal location
a–d, Vectorized trajectories (a,b) and average posterior probability sum (c,d) of all confirmed home-events (left) and away-events (right) for R1,D1. Red dots in a,b: rat location at time of event. Dashed box in c,d: HOME location. e, Left, Posterior probability sum for all away-events across all rats. HOME (red) is a statistical outlier. P-value (Grubbs’ test for outliers): D1 2.3x10⁻² (Lilliefors test, P-value 0.15); D2 1.1x10⁻² (Lilliefors P-value 0.32). Center, Number of away-events across all rats in which the final frame peak posterior probability was at each well. HOME (red) is a statistical outlier. P-values (Grubbs’ test for outliers): D1 6.9x10⁻⁴ (Lilliefors test, P-value 0.29); D2 6.0x10⁻⁴ (Lilliefors P-value 0.42). Right, as left, but mean ± s.e.m. for HOME (H), all wells with greater in-session total occupancy than HOME (G), and all wells with less occupancy than HOME (L). P-values (ANOVA, Tukey-Kramer post-hoc multiple comparison): D1 H vs. G 2.9x10⁻³, H vs. L 8.5x10⁻⁵, G vs. L 0.91; D2 H vs. G 7.4x10⁻⁸, H vs. L <1x10⁻¹⁰, G vs. L 0.82.
Figure 4
Figure 4. Representation of relevant vs. irrelevant locations
a, Vectorized trajectories (left) and average posterior probability sum (right) of all home-events for R1,D1, centered by rat’s physical location at time of event and rotated and scaled according to direction and distance to the previously rewarded RANDOM location. White circles: quantified regions. b, As a, for HOME. c–e, Across all rats, mean representation of quantified regions as in a–b. Event number displayed on bar. f, Normalized ratio of well/rat representation for c–e. P-values (Wilcoxon rank sum test): D1 HOME vs. Prev. RANDOM 4.4x10⁻¹⁶, HOME vs. Next RANDOM 9.9x10⁻³; D2 HOME vs. Prev. RANDOM 3.1x10⁻²⁰, HOME vs. Next RANDOM 1.3x10⁻¹³.
Figure 5
Figure 5. Correspondence to past or future path
a–b, Representative event from R1, D1, demonstrating trajectory event vector (black), immediate future (green) and past (magenta) path (up to greater of 10 s or 50 cm), and angular displacement along the minor arc between event and future (a) or past (b) path at each crossing. c, Percent of crossings across all events as a function of angular displacement for all away-events compared to future (left) or past (right) path. Dashed line indicates chance based upon 2,000 shuffled events. d, Mean absolute angular displacement for away-events compared to future (A-FP) or past (A-PP) path. e–f, As c–d, for home-events. g, Mean absolute angular displacement for future path for all away-events (A-FP) or home-events (H-FP). P-values (Wilcoxon rank-sum test): d) 8.60x10⁻³¹; f) 3.54x10⁻¹⁷; g) 7.25x10⁻¹⁶.
Figure 6
Figure 6. Goal switching and flexibility in trajectory events
a–b, As Figure 5c (left) and 5d, for away-events preceding behavior ending at or crossing HOME (future path, H-FP; past path, H-PP). c–d, As a–b, for away-events preceding behaviors directed elsewhere. e, Mean posterior probability representation of HOME for same division of away-events (to HOME, H; not to HOME, NH). f–g, As 5c–d, for away-events from the first 19 trials of each session (future path, A19-FP; past path, A19-PP). P-values (Wilcoxon rank-sum test): b) 4.96x10⁻²²; d) 1.12x10⁻¹³; e) 9.60x10⁻³; g) 2.37x10⁻¹⁰.

Comment in

References

    1. O’Keefe J, Nadel L. The Hippocampus As A Cognitive Map. Clarendon; 1978.
    1. Morris RG, Garrud P, Rawlins JN, O’Keefe J. Place navigation impaired in rats with hippocampal lesions. Nature. 1982;297:681–683. - PubMed
    1. Scoville WB, Milner B. Loss of recent memory after bilateral hippocampal lesions. J Neurol Neurosurg Psychiatry. 1957;20:11–21. - PMC - PubMed
    1. Olton DS, Samuelson RJ. Remembrance of places past: spatial memory in rats. J Exp Psychol Anim Behav Process. 1976;2:97–116.
    1. Levy WB. A sequence predicting CA3 is a flexible associator that learns and uses context to solve hippocampal-like tasks. Hippocampus. 1996;6:579–590. - PubMed

Publication types