

Review
doi: 10.1038/nrg3433.
Computational solutions for omics data
Affiliations
- PMID: 23594911
- PMCID: PMC3966295
- DOI: 10.1038/nrg3433
Item in Clipboard
Review
Computational solutions for omics data
Nat Rev Genet.
2013 May.
Abstract
High-throughput experimental technologies are generating increasingly massive and complex genomic data sets. The sheer enormity and heterogeneity of these data threaten to make the arising problems computationally infeasible. Fortunately, powerful algorithmic techniques lead to software that can answer important biomedical questions in practice. In this Review, we sample the algorithmic landscape, focusing on state-of-the-art techniques, the understanding of which will aid the bench biologist in analysing omics data. We spotlight specific examples that have facilitated and enriched analyses of sequence, transcriptomic and network data sets.
Figures
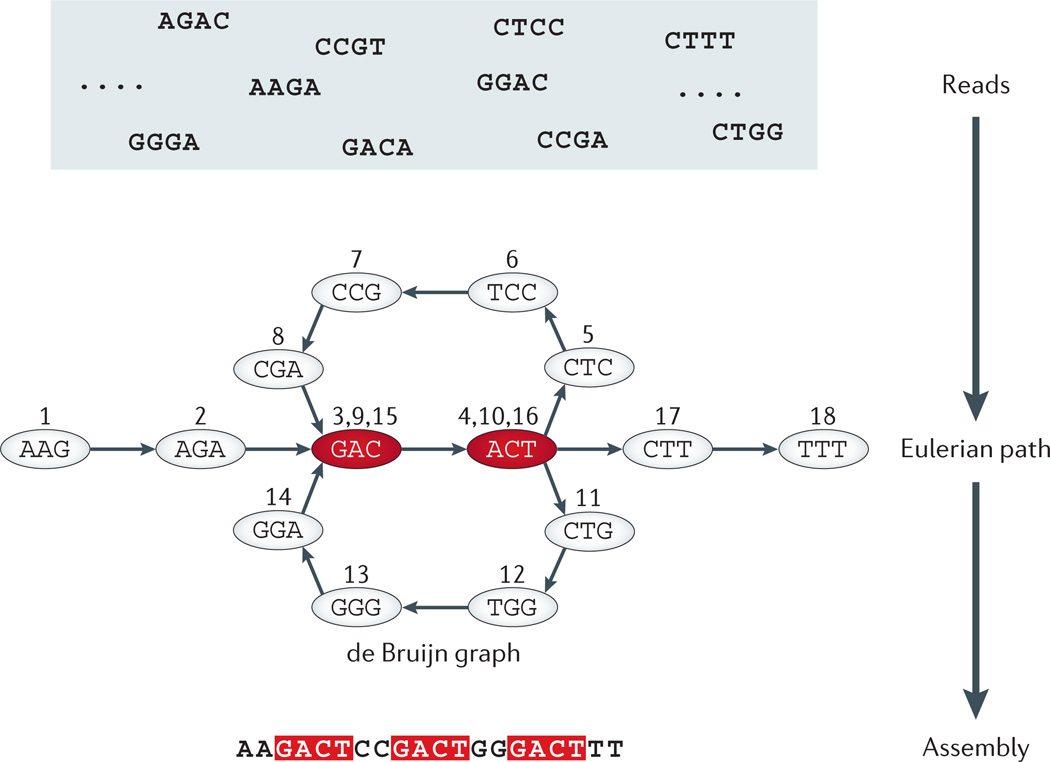
Each directed edge in a de Bruijn graph denotes a sequence read or a fragment of fixed length (4 bp in the figure); the source node of this edge is a prefix string of the read omitting the last nucleotide; the destination node of this edge is a suffix string of the same read (or sequence fragment) by omitting the first nucleotide. In the example shown in this figure, the top panel is a pool of representative short reads or fragments. In the middle panel, each node denotes a unique sequence prefix or suffix segment of length 3 bp found in the original reads of length 4 bp. The assembly of DNA sequences (segments) is thus represented as a de Bruijn graph. Assembling reads (or sequence fragments) in a de Bruijn graph reduces the problem to a fragment assembly problem that can be formulated as the goal to find a trail or Eularian path that visits each edge (read or fragment) in the (de Bruijn) graph exactly once. Nucleotides with a red background occur more than once in the sequence. Numbers on the edges represent an ordered Eulerian path through the de Bruijn graph, which can be followed to reconstruct the assembled sequence from the compact graph representation.
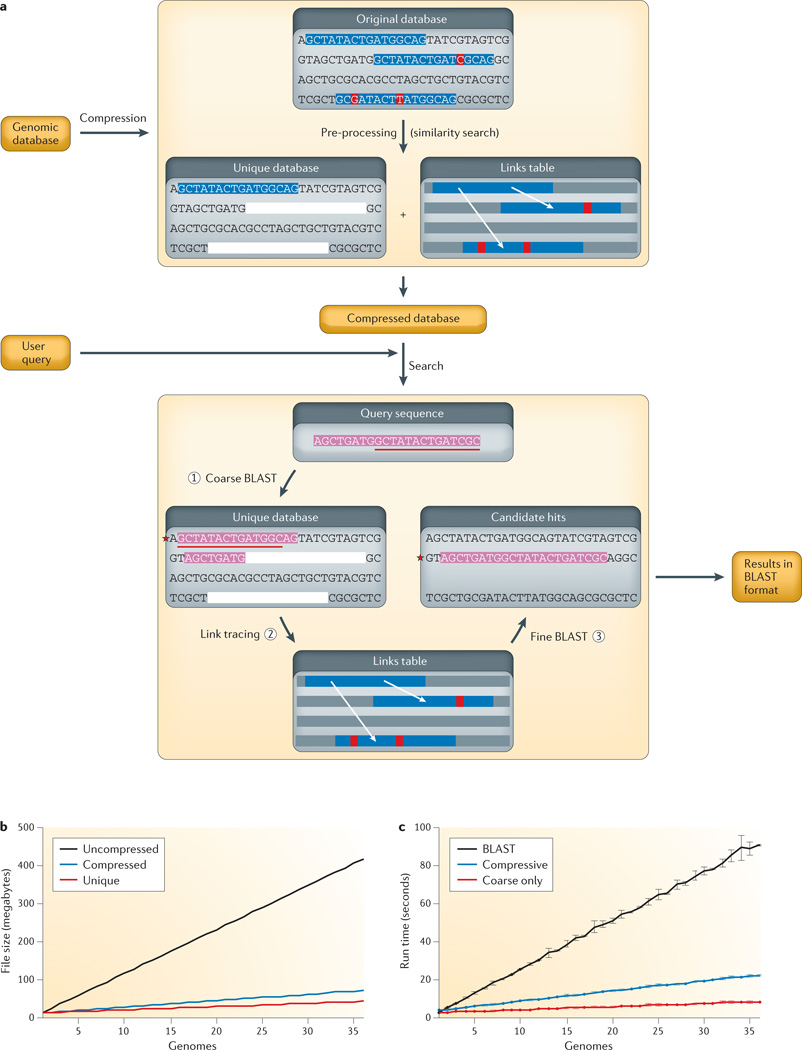
a | Flow chart of CaBLAST. First, redundancy in the genomic database is identified and removed to create a unique database consisting of a smaller set of segmental exemplars. Only the first occurrence of repetitive sequence segments is retained, as represented by the blue background, and other similar regions are removed (blanked out in the pre-processing step) and encoded in a links table to their original locations. The red background indicates locations of unique bases within the repetitive element. An edit script compression technique is used to encode similar sequence fragments with reduced storage in a compressed database. After the compressed database is constructed, a coarse-to-fine strategy is adopted for sequence search. First, a BLAST search is run using the query sequence (shown with a pink background) against the unique database with a relaxed E value threshold to identify high-scoring hits. Second, the additional candidate hits are recovered by tracing through the links table. Third, BLAST is run against the final candidate hits. b,c | CaBLAST storage requirements and running time comparisons on uncompressed (black) and compressed (blue, full compressed database; red, only unique database or coarse search) genome sequence databases consisting of 1 to 36 yeast genomes.
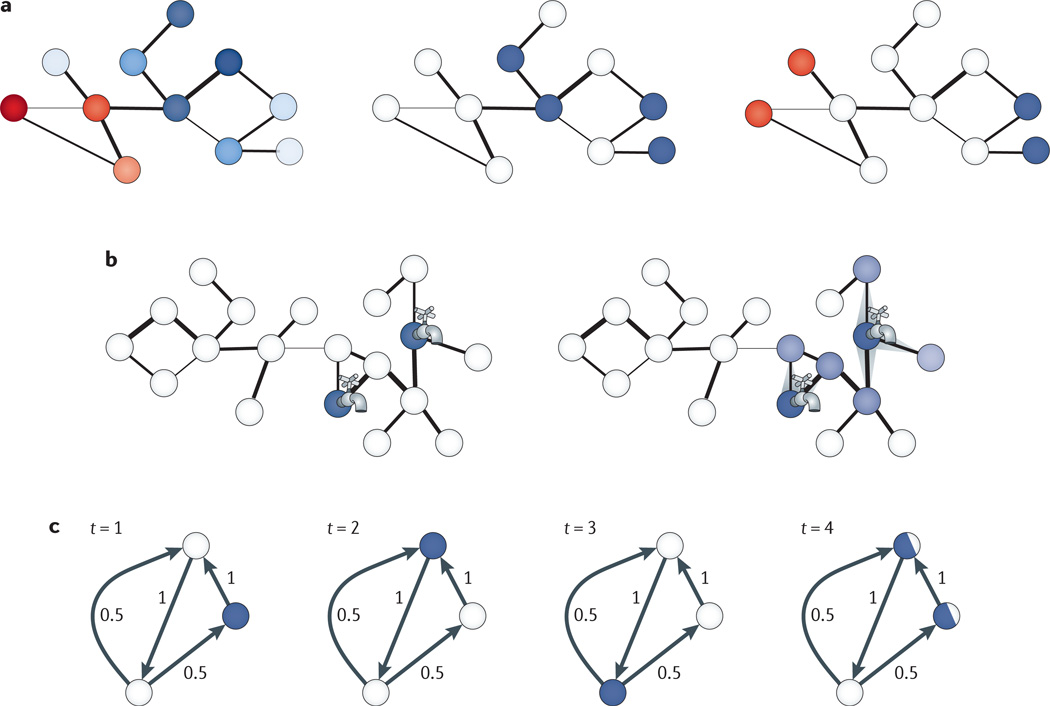
a | Schematics of computational formulations that arise when incorporating genomic data within a network context. Nodes correspond to biological components (for example, genes, proteins or other molecules), and edges correspond to known interactions among them (for example, physical, regulatory or genetic). In the left-hand panel, an attribute of interest has been measured for all molecules of the network (for example, differential gene expression values, shown in shades of blue and red). The goal is to uncover subnetworks that contain genes with similar values of attributes (for example, similarly differentially expressed, as shaded in similar colours in this panel). In the middle panel, a subset of genes has been identified as being of interest (for example, involved in some disease, shown in blue), and the goal is to uncover additional genes that take part in the same underlying pathway or functional module, as suggested by proximity in the network. In the right-hand panel, two subsets of genes, shown here in blue and red, have been identified (for example, corresponding to target genes, the expression values of which have changed and genes within loci that are associated with these targets), and the goal is to find paths in the network connecting these genes. b | Given an initial set of molecules (for example, genes that affect a phenotype of interest or that are involved in some disease), subnetworks containing additional genes of interest can be inferred using network flow approaches. The initial set of molecules comprises source nodes, from which fluid is pumped into the network, as represented by the taps. Each interaction between nodes can be weighted (for example, according to an estimate of the reliability of an interaction), and this weight can be used as a capacity to restrict the amount of flow that can go over the edge, as shown by the width of the edge. At each iteration of the algorithm, a node pumps flow to its neighbours while satisfying capacity constraints, and flow spreads through the network from the source nodes. Higher amounts of fluids through a node are shown with darker colours (right). In the classic network flow formulation, the amount of fluid in the network is maintained, whereas in other formulations fluid is pumped into the source nodes at a constant rate,. c | Random-walk-based approaches are also used to identify subnetworks from an initial set of molecules of interest. Starting from an initial node (for example, one of a set of known disease genes), a neighbour is repeatedly selected at random according to the distribution of transition probabilities between nodes, which can be set uniformly or based on estimates of the reliabilities of interactions or some other attribute of interest, such as co-expression between genes. In most applications, the walker also has some probability of staying at its current position at each step or jumping to any node chosen according to a pre-specified probability distribution (for example, to each disease gene with equal probability). In the shown example, at each time point, the distribution of the walker’s position is shown in blue. In the fourth time step (right), the walker is equally likely to be in one of two locations, and at each subsequent step, the probability of the walker being at each location can be estimated. After the probability estimates have converged, proteins are ranked (for example, as candidate disease genes) according to the probability that the walker is at the corresponding node.
References
Publication types
MeSH terms
Grants and funding
LinkOut - more resources
Full Text Sources
Other Literature Sources
