Randomized Controlled Trial
. 2013 Apr 17;5(4):1253-75.
doi: 10.3390/nu5041253.

Higher serum 25-hydroxyvitamin D concentrations associate with a faster recovery of skeletal muscle strength after muscular injury

Affiliations
Randomized Controlled Trial

Higher serum 25-hydroxyvitamin D concentrations associate with a faster recovery of skeletal muscle strength after muscular injury

Tyler Barker et al. Nutrients. .

Abstract

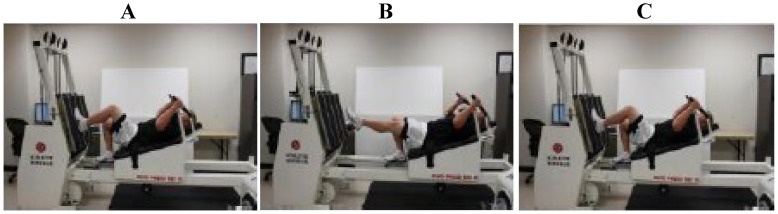
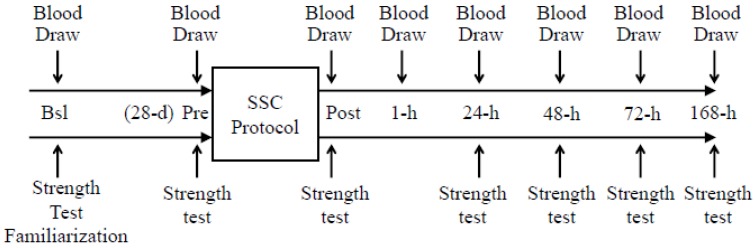
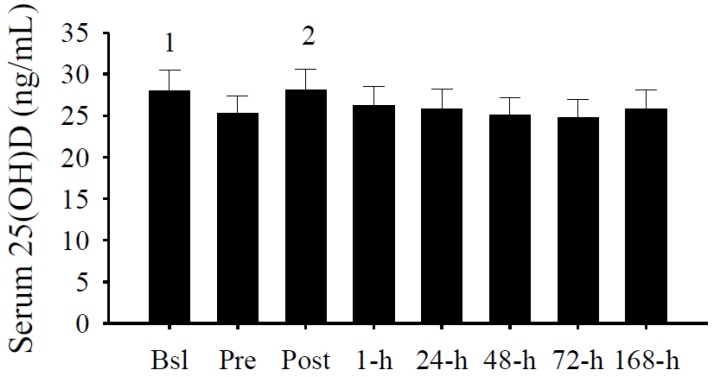
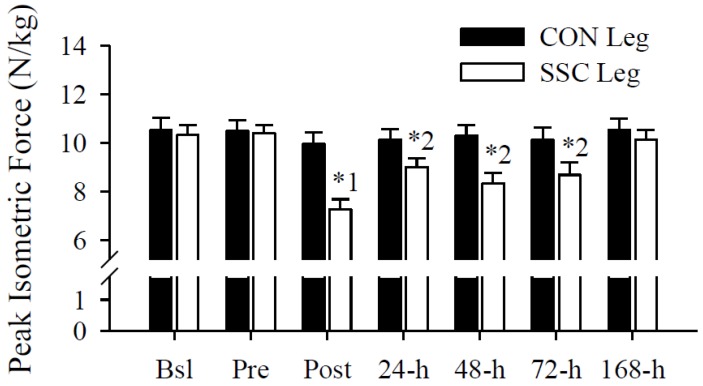
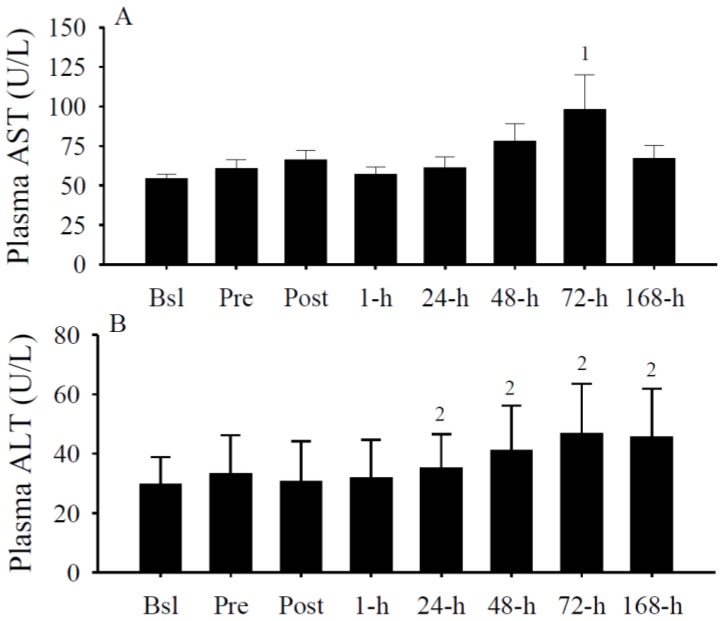
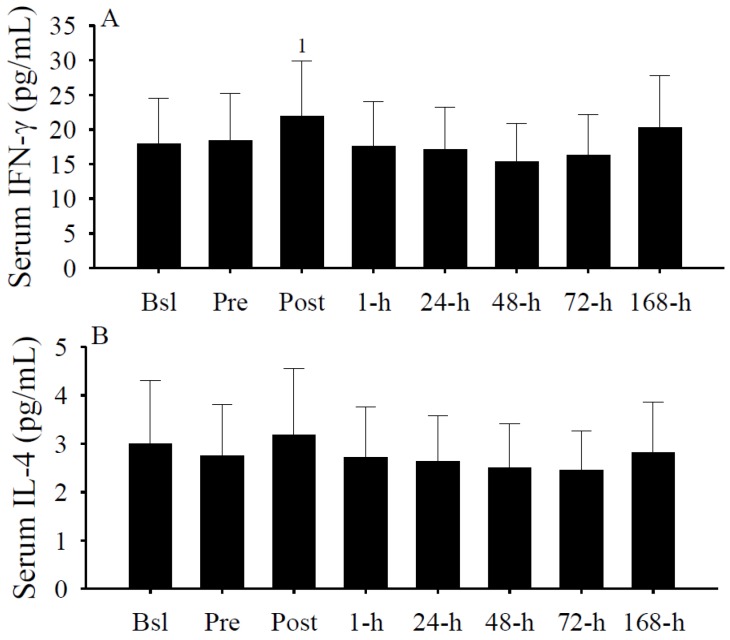
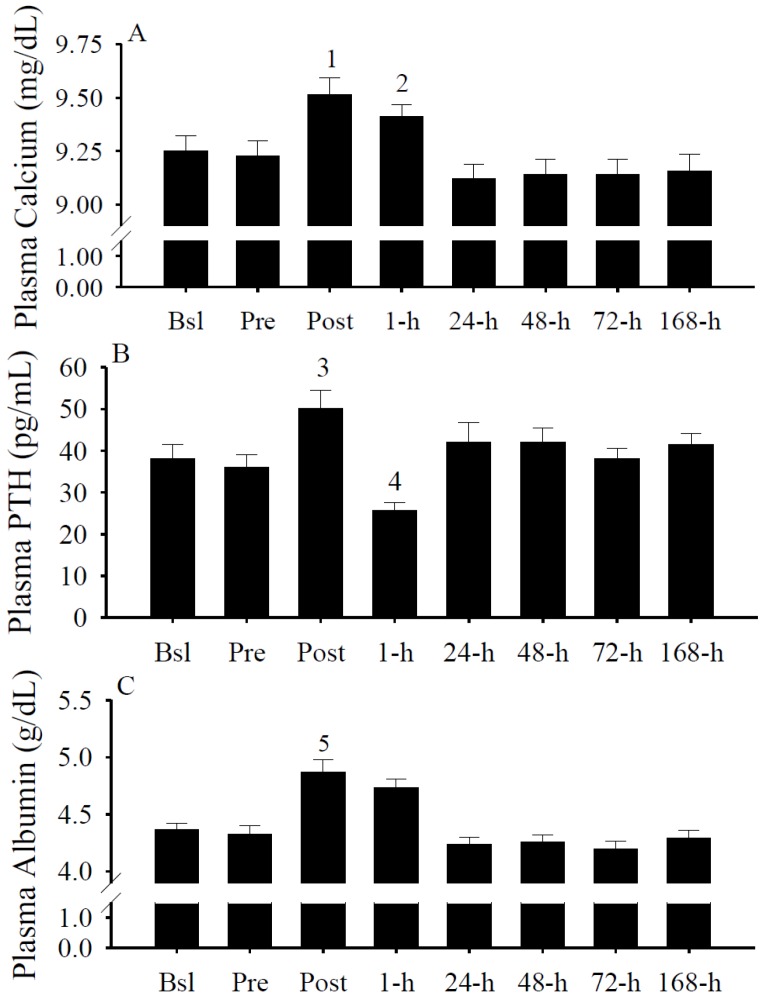
The primary purpose of this study was to identify if serum 25-hydroxyvitamin D (25(OH)D) concentrations predict muscular weakness after intense exercise. We hypothesized that pre-exercise serum 25(OH)D concentrations inversely predict exercise-induced muscular weakness. Fourteen recreationally active adults participated in this study. Each subject had one leg randomly assigned as a control. The other leg performed an intense exercise protocol. Single-leg peak isometric force and blood 25(OH)D, aspartate and alanine aminotransferases, albumin, interferon (IFN)-γ, and interleukin-4 were measured prior to and following intense exercise. Following exercise, serum 25(OH)D concentrations increased (p < 0.05) immediately, but within minutes, subsequently decreased (p < 0.05). Circulating albumin increases predicted (p < 0.005) serum 25(OH)D increases, while IFN-γ increases predicted (p < 0.001) serum 25(OH)D decreases. Muscular weakness persisted within the exercise leg (p < 0.05) and compared to the control leg (p < 0.05) after the exercise protocol. Serum 25(OH)D concentrations inversely predicted (p < 0.05) muscular weakness (i.e., control leg vs. exercise leg peak isometric force) immediately and days (i.e., 48-h and 72-h) after exercise, suggesting the attenuation of exercise-induced muscular weakness with increasing serum 25(OH)D prior to exercise. Based on these data, we conclude that pre-exercise serum 25(OH)D concentrations could influence the recovery of skeletal muscle strength after an acute bout of intense exercise.


Figures

Figure 1
Figure 1
Examples of the single-leg strength testing and the intense-stretch shortening contraction (SSC) protocol on the horizontal Plyo-press. (A) The weight stack resistance was overloaded to prevent sled movement in order to achieve isometric testing. (AC) Subjects performed repetitive single-leg jumps during the SSC protocol. Illustrated below is an example of a subject in the push-off position (A), at peak height of the jump (B), and the subsequent landing (C) during the SSC protocol. Subjects performed 10 sets of 10 jumps with a 20-s rest between each set at 75% of body mass on one leg only (i.e., SSC leg). Note: This figure is adapted with permission from [68]. Copyright © Barker et al.; licensee BioMed Central Ltd.
Figure 2
Figure 2
Study protocol. Each subject provided eight fasting blood draws. The first blood draw was performed at baseline (Bsl) and 28-day before the SSC protocol. The rationale for collecting this sample 28-day before the SSC protocol was to allow for the seasonal decrease in serum 25(OH)D concentrations. The second blood draw was obtained immediately before (Pre) the SSC protocol. The six remaining blood draws were performed immediately (i.e., Post), 1-h, 24-h, 48-h, 72-h and 168-h (i.e., 7 days) after the SSC protocol. Subjects were familiarized with the single-leg peak isometric force testing procedure at Bsl. Thereafter, single-leg peak isometric force measurements were performed on six different occasions: (1) immediately before (Pre) the SSC protocol; and (2) immediately (Post); (3) 24-h; (4) 48-h; (5) 72-h and (6) 168-h after the SSC protocol.
Figure 3
Figure 3
Serum 25(OH)D concentrations (ng/mL). Serum 25(OH)D concentrations were significantly increased at Bsl (1 p < 0.05 vs. Pre, 48-h, and 72-h) and Post (2 p < 0.05 vs. Pre, 24-h, 48-h, 72-h, and 168-h). Data presented as mean ± SEM.
Figure 4
Figure 4
Peak isometric force (N/kg). Single leg peak isometric forces were significantly (leg, time interaction, p < 0.05) different following the SSC protocol. Single-leg peak isometric forces were not significantly different within the control (CON) leg across time, but within the SSC leg, decreased immediately (1 p < 0.05 vs. Bsl, Pre, 24-h, 72-h, and 168-h) and remained impaired several days (2 p < 0.05 vs. Bsl, Pre, and 168-h) after the intense exercise protocol. Peak isometric forces were also significantly (* p < 0.05) decreased in the SSC leg compared to those in the CON leg at Post, 24-h, 48-h, and 72-h. Data presented as mean ± SEM.
Figure 5
Figure 5
Plasma aspartate aminotransferase (AST) (U/L) and ALT (U/L) concentrations. (A) Plasma AST was significantly increased at 72-h (1 p < 0.05 vs. Bsl). (B) Plasma ALT was significantly (2 p < 0.05 vs. Post) increased at 24-h, 72-h, and 168-h. Data presented as mean ± SEM.
Figure 6
Figure 6
Serum IFN-γ and IL-4 concentrations (pg/mL). Serum IFN-γ concentrations (A) were significantly (1 p < 0.05 vs. 1-h, 48-h, and 72-h) increased at Post. Serum IL-4 concentrations (B) were not significantly different. Data presented as mean ± SEM.
Figure 7
Figure 7
Plasma calcium (mg/dL), parathyroid hormone (PTH; pg/mL), and albumin (g/dL) concentrations. (A) Total plasma calcium concentrations were significantly increased at Post (1 p < 0.05 vs. Bsl, Pre, 24-h, 48-h, 72-h, and 168-h) and 1-h (2 p < 0.05 vs. 24-h, 48-h, 72-h, and 168-h). (B) Plasma PTH concentrations were significantly increased at Post (3 p < 0.05 vs. Bsl, Pre, 1-h, and 72-h) and significantly decreased at 1-h (4 p < 0.05 vs. 24-h, 48-h, and 168-h). (C) Plasma albumin concentrations were significantly increased at Post (5 p < 0.05 vs. Bsl, Pre, 1-h, 24-h, 48-h, 72-h, and 168-h). Data presented as mean ± SEM.

References

    1. Jones G. Pharmacokinetics of vitamin D toxicity. Am. J. Clin. Nutr. 2008;88:582S–586S. - PubMed
    1. Girgis C.M., Clifton-Bligh R.J., Hamrick M.W., Holick M.F., Gunton J.E. The roles of vitamin D in skeletal muscle: form, function, and metabolism. Endocr. Rev. 2013;34:33–83. doi: 10.1210/er.2012-1012. - DOI - PubMed
    1. Ceglia L., Harris S.S. Vitamin D and its role in skeletal muscle. Calcif. Tissue Int. 2013;92:151–162. doi: 10.1007/s00223-012-9645-y. - DOI - PubMed
    1. Bischoff-Ferrari H., Stahelin H.B., Walter P. Vitamin D effects on bone and muscle. Int. J. Vitam. Nutr. Res. 2011;81:264–272. doi: 10.1024/0300-9831/a000072. - DOI - PubMed
    1. Ceglia L. Vitamin D and skeletal muscle tissue and function. Mol. Aspects Med. 2008;29:407–414. doi: 10.1016/j.mam.2008.07.002. - DOI - PubMed

Publication types

MeSH terms