. 2013 Jul;23(7):1142-54.
doi: 10.1101/gr.144840.112. Epub 2013 Apr 17.

Interplay between chromatin state, regulator binding, and regulatory motifs in six human cell types

Affiliations

Interplay between chromatin state, regulator binding, and regulatory motifs in six human cell types

Jason Ernst et al. Genome Res. 2013 Jul.

Abstract

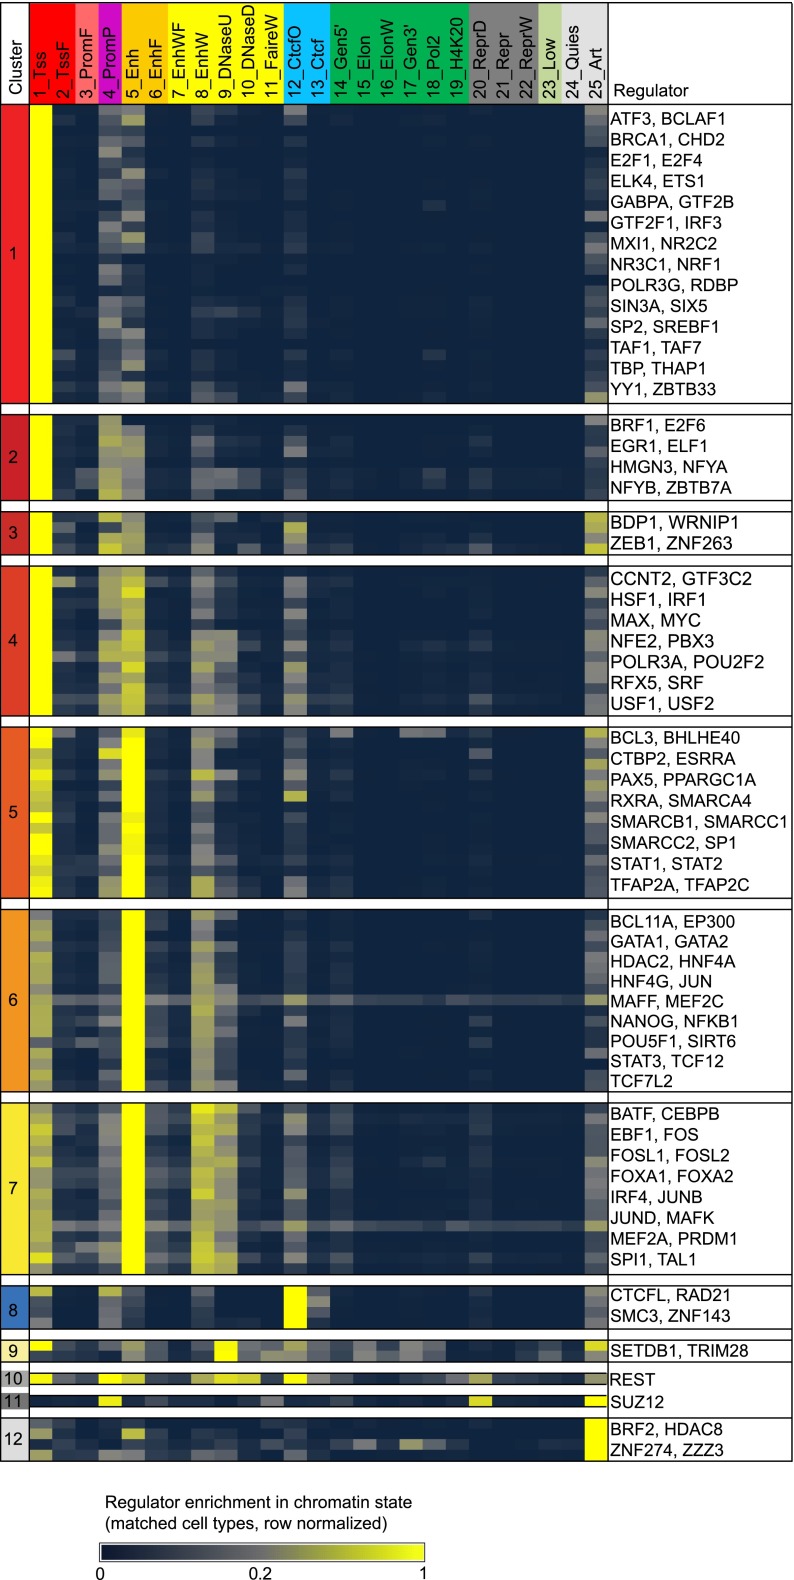
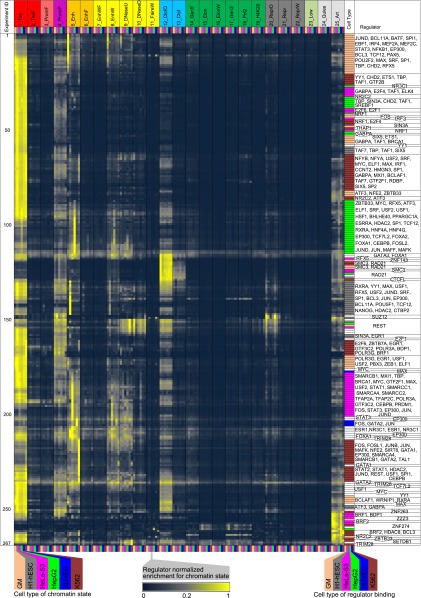
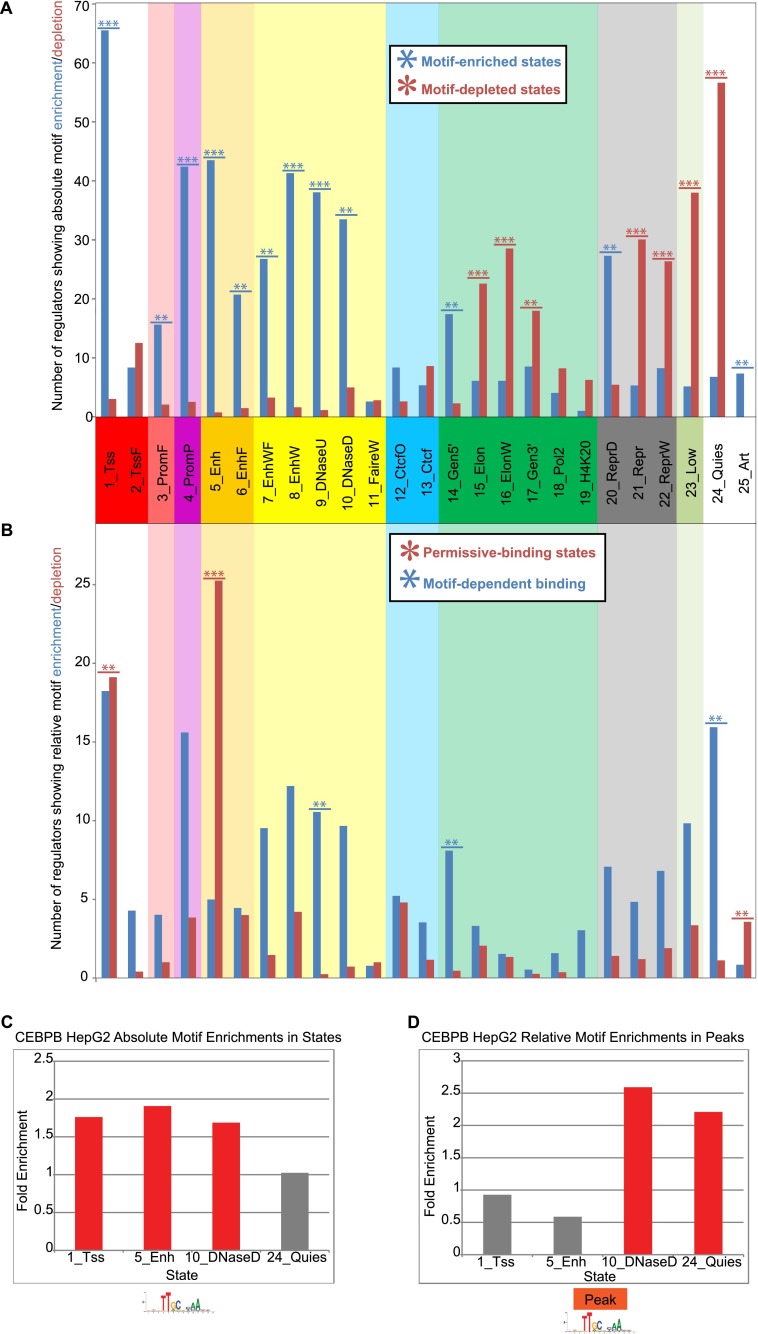
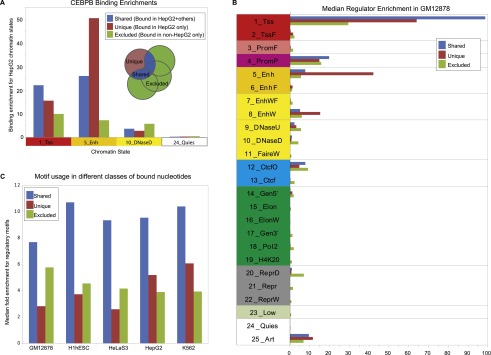
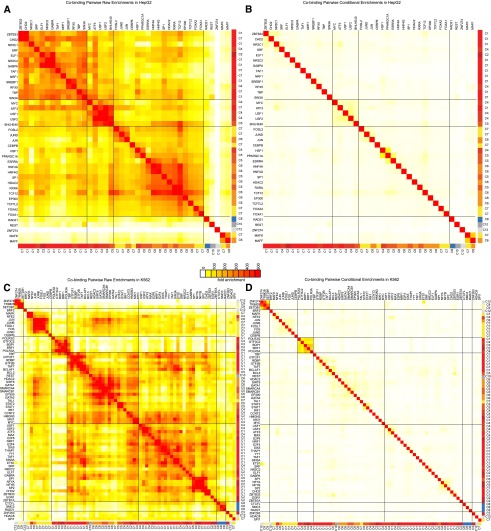
The regions bound by sequence-specific transcription factors can be highly variable across different cell types despite the static nature of the underlying genome sequence. This has been partly attributed to changes in chromatin accessibility, but a systematic picture has been hindered by the lack of large-scale data sets. Here, we use 456 binding experiments for 119 regulators and 84 chromatin maps generated by the ENCODE in six human cell types, and relate those to a global map of regulatory motif instances for these factors. We find specific and robust chromatin state preferences for each regulator beyond the previously reported open-chromatin association, suggesting a much richer chromatin landscape beyond simple accessibility. The preferentially bound chromatin states of regulators were enriched for sequence motifs of regulators relative to all states, suggesting that these preferences are at least partly encoded by the genomic sequence. Relative to all regions bound by a regulator, however, regulatory motifs were surprisingly depleted in the regulator's preferentially bound states, suggesting additional non-sequence-specific binding beyond the level predicted by the regulatory motifs. Such permissive binding was largely restricted to open-chromatin regions showing histone modification marks characteristic of active enhancer and promoter regions, whereas open-chromatin regions lacking such marks did not show permissive binding. Lastly, the vast majority of cobinding of regulator pairs is predicted by the chromatin state preferences of individual regulators. Overall, our results suggest a joint role of sequence motifs and specific chromatin states beyond mere accessibility in mediating regulator binding dynamics across different cell types.


Figures

Figure 1.
Figure 1.
Regulator enrichments for each chromatin state in matched cell types. Different regulators show distinct chromatin state preferences. For each regulator with matching chromatin data, the average enrichment is shown for each chromatin state (columns). Enrichments have been row-normalized, scaling by the largest enrichment value for each experiment. K-means clustering with 12 clusters produced the clusters labeled C1–C12.
Figure 2.
Figure 2.
Dynamics of regulator enrichment in different chromatin states across cell types. Each row corresponds to one regulator in a given cell type. Each column corresponds to a state-cell type combination. The columns are organized first by state and then by cell type in the following order: Gm12878, H1-hESC, HeLa-S3, HepG2, HUVEC, and then K562. The rows have been automatically ordered computationally using a traveling salesman problem instance solver, and reveal both regulator and cell type groups. The fold enrichments have been row-normalized, scaled to the maximum enrichment in the row. In the six columns of each group, yellow indicates higher enrichment values and blue lower enrichment values. The next-to-last column indicates the cell type of the experiment color-coded, with all GM cell types colored the same and all other non-Tier 1 and 2 cell types colored white. The last column indicates the regulators of the experiments listed consecutively within the same cell type block.
Figure 3.
Figure 3.
Motif enrichment and depletion variation across chromatin states. (A) Number of transcription factors with significantly enriched or depleted motif instances in each state at a P-value of 0.001 (see Methods). The maximum value for the y-axis was 79, corresponding to the number of transcription factors considered with regulatory motif instances available. If a transcription factor was profiled multiple times, each experiment was counted inversely proportional to the number of times it was profiled. Stars indicate if the number of transcription factors with significantly enriched (depleted) motifs in a state is significant based on a binomial distribution with the number of samples equal to the total number of significant enrichments or depletions in the state and the probability of success equal to the proportion of significant enrichments (depletions) of all significant enrichments or depletions across all states. Fractional values were first rounded to the nearest integer for the calculation. The P-value cutoff for triple stars was 10−6 and for double stars was 0.01. (B) Number of transcription factors with significantly enriched or depleted motif instances in each state conditioning on regions falling within a peak. Stars were computed the same way as in A except a 0.05 P-value cutoff was used for double stars. (C) Fold enrichment for CEBPB motifs in four different HepG2 chromatin states. (D) Fold enrichments for CEBPB motifs within peaks in the same four states relative to the baseline motif enrichment in peaks.
Figure 4.
Figure 4.
Dynamic binding enrichments. (A) The enrichment in four HepG2 chromatin states for locations of the genome that are bound by CEBPB in HepG2 and another cell type, only in HepG2, and in another cell type but not HepG2. (B) The median enrichment over all regulators in Gm12878 for the three different classes of dynamic binding (for other cell types, see Supplemental Figs. 19, 20). (C) The median enrichment of regulatory motifs in bound regions for the different classes of dynamic binding.
Figure 5.
Figure 5.
Pairwise regulator cobinding enrichments are captured by chromatin state preferences. (A) Pairwise regulator cobinding enrichment for all pairs of regulators in HepG2 show strong groups of cobinding. The regulators in each group are typically assigned to the same set of chromatin state cluster preferences from Figure 1. Enrichment levels up to 500-fold are found for the full pairwise enrichment table. Rows of the table have been ordered to maximize correlation of neighboring rows. Black lines correspond to groups of highly enriched pairs of regulators that emerge from this ordering. (B) After conditioning on the chromatin state preferences for each regulator (see Methods), the pairwise regulator enrichments are dramatically reduced. (C,D) The same as A and B except for K562. Other cell types can be found in Supplemental Figure 21.

References

    1. Applegate DL, Bixby RE, Chvatal V, Cook WJ 2006. The traveling salesman problem: A computational study. Princeton University Press, Princeton, NJ
    1. Bar-Joseph Z, Gifford DK, Jaakkola TS 2001. Fast optimal leaf ordering for hierarchical clustering. Bioinformatics 17: S22. - PubMed
    1. Barski A, Cuddapah S, Cui K, Roh TY, Schones DE, Wang Z, Wei G, Chepelev I, Zhao K 2007. High-resolution profiling of histone methylations in the human genome. Cell 129: 823–837 - PubMed
    1. Bernstein BE, Mikkelsen TS, Xie X, Kamal M, Huebert DJ, Cuff J, Fry B, Meissner A, Wernig M, Plath K, et al. 2006. A bivalent chromatin structure marks key developmental genes in embryonic stem cells. Cell 125: 315–326 - PubMed
    1. Biedl T, Brejová B, Demaine ED, Hamel AM, Vinar T 2001. Optimal arrangement of leaves in the tree representing hierarchical clustering of gene expression data. Tech. Rep. 2001, Department of Computer Science, University of Waterloo, Ontario, Canada, p. 14

Publication types