. 2013 Jun;125(6):841-59.
doi: 10.1007/s00401-013-1112-y. Epub 2013 Apr 18.

Insufficient OPC migration into demyelinated lesions is a cause of poor remyelination in MS and mouse models

Affiliations

Insufficient OPC migration into demyelinated lesions is a cause of poor remyelination in MS and mouse models

Amanda Boyd et al. Acta Neuropathol. 2013 Jun.

Abstract

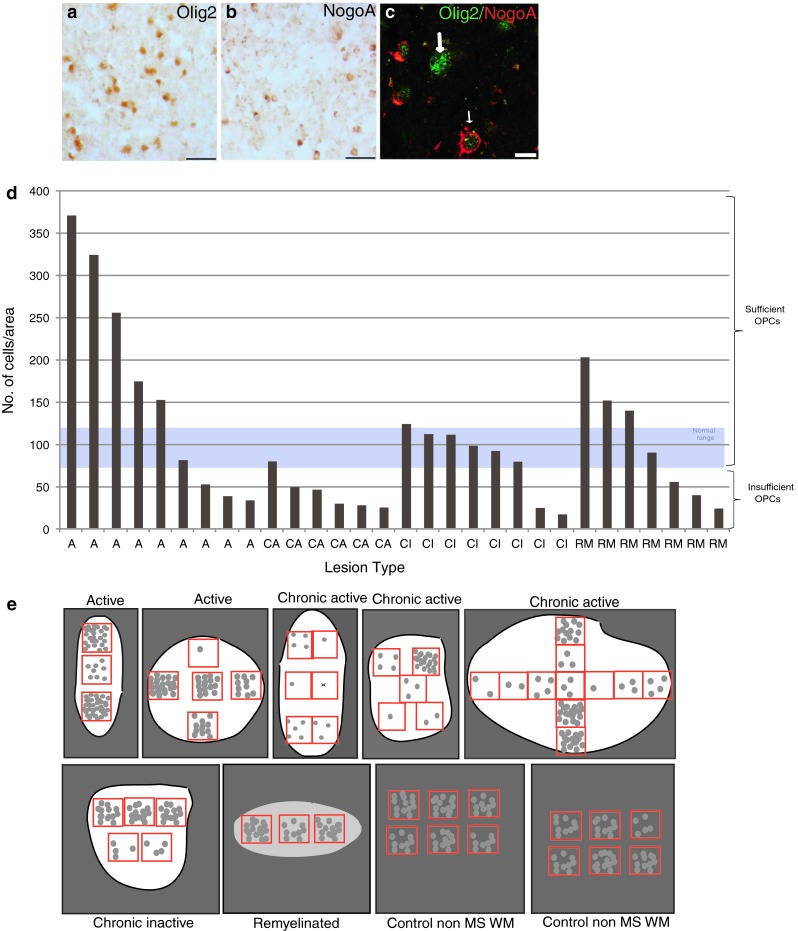
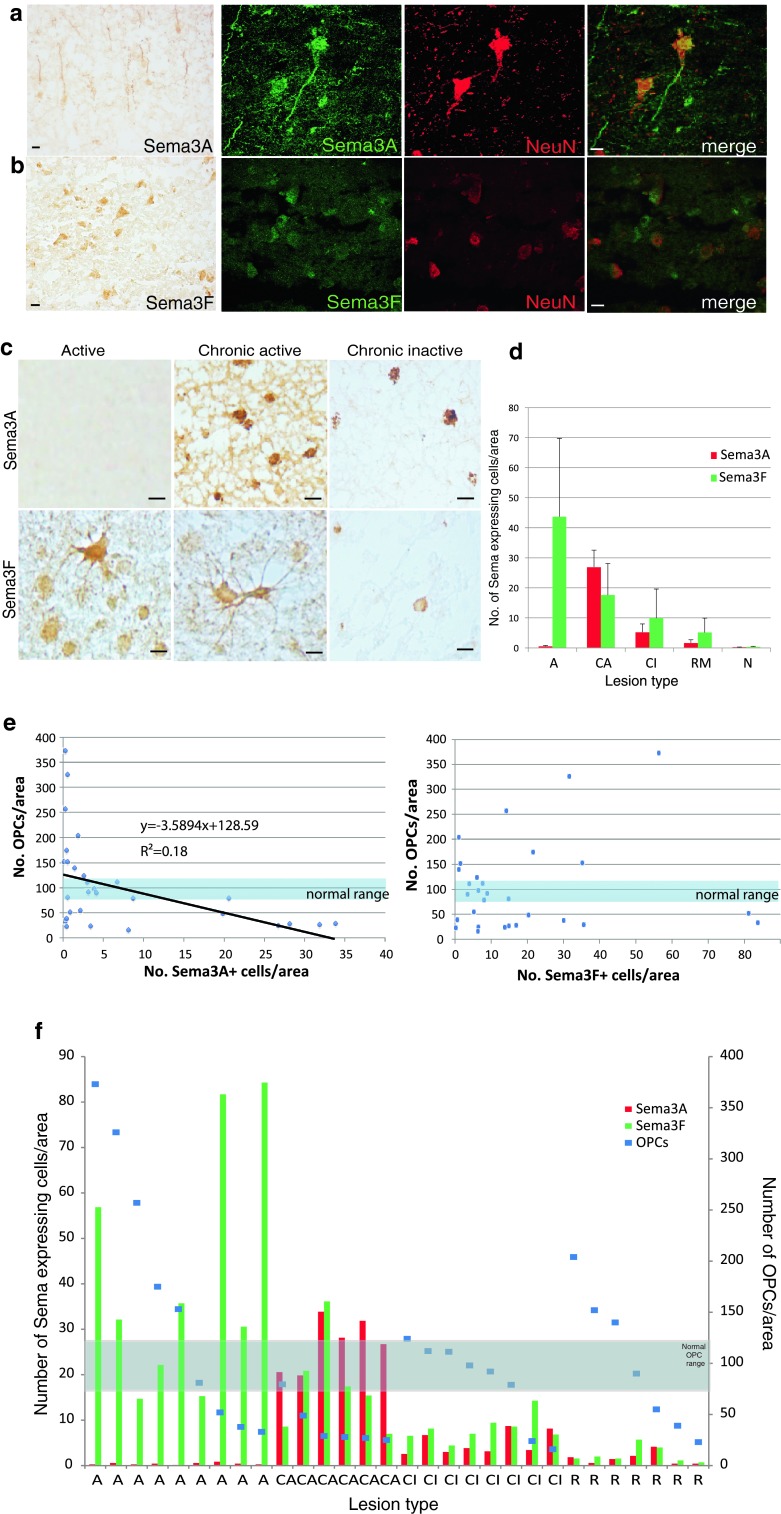
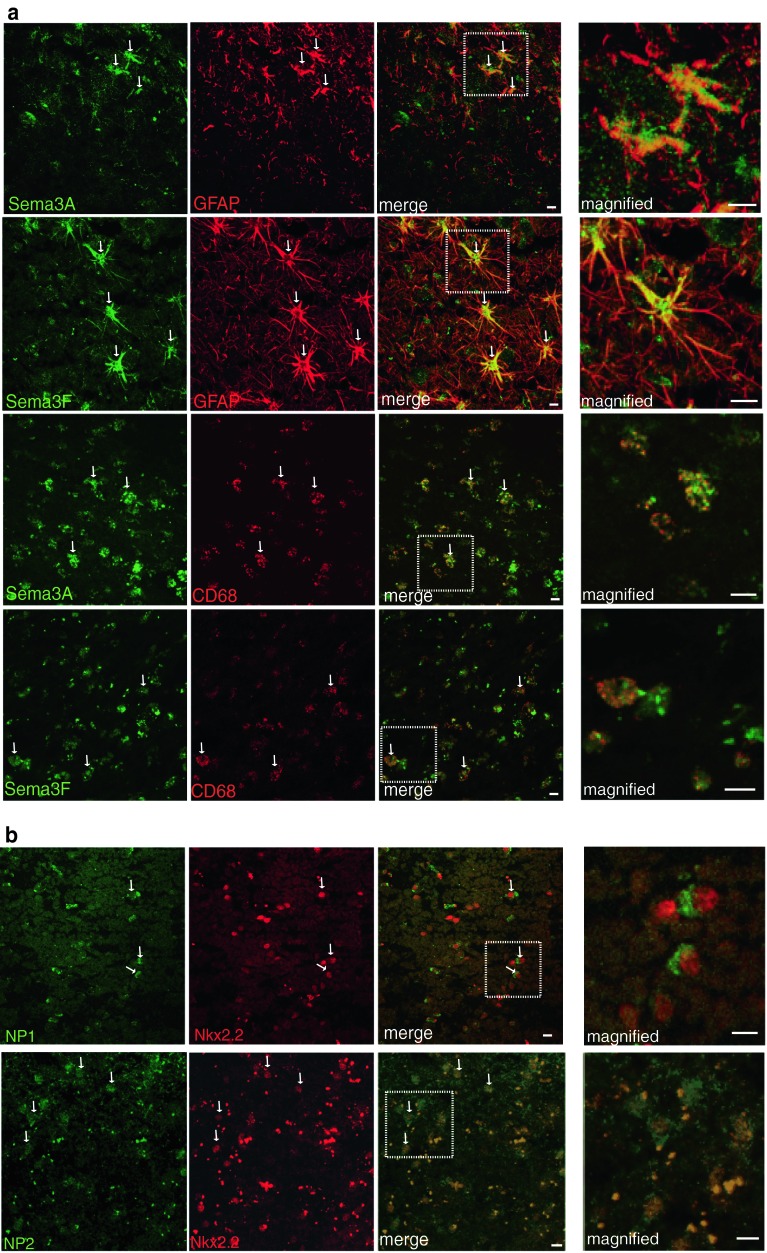
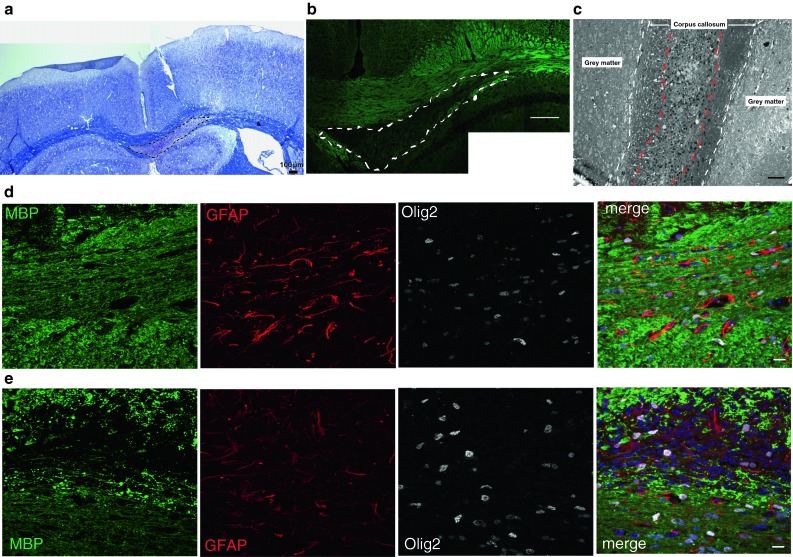
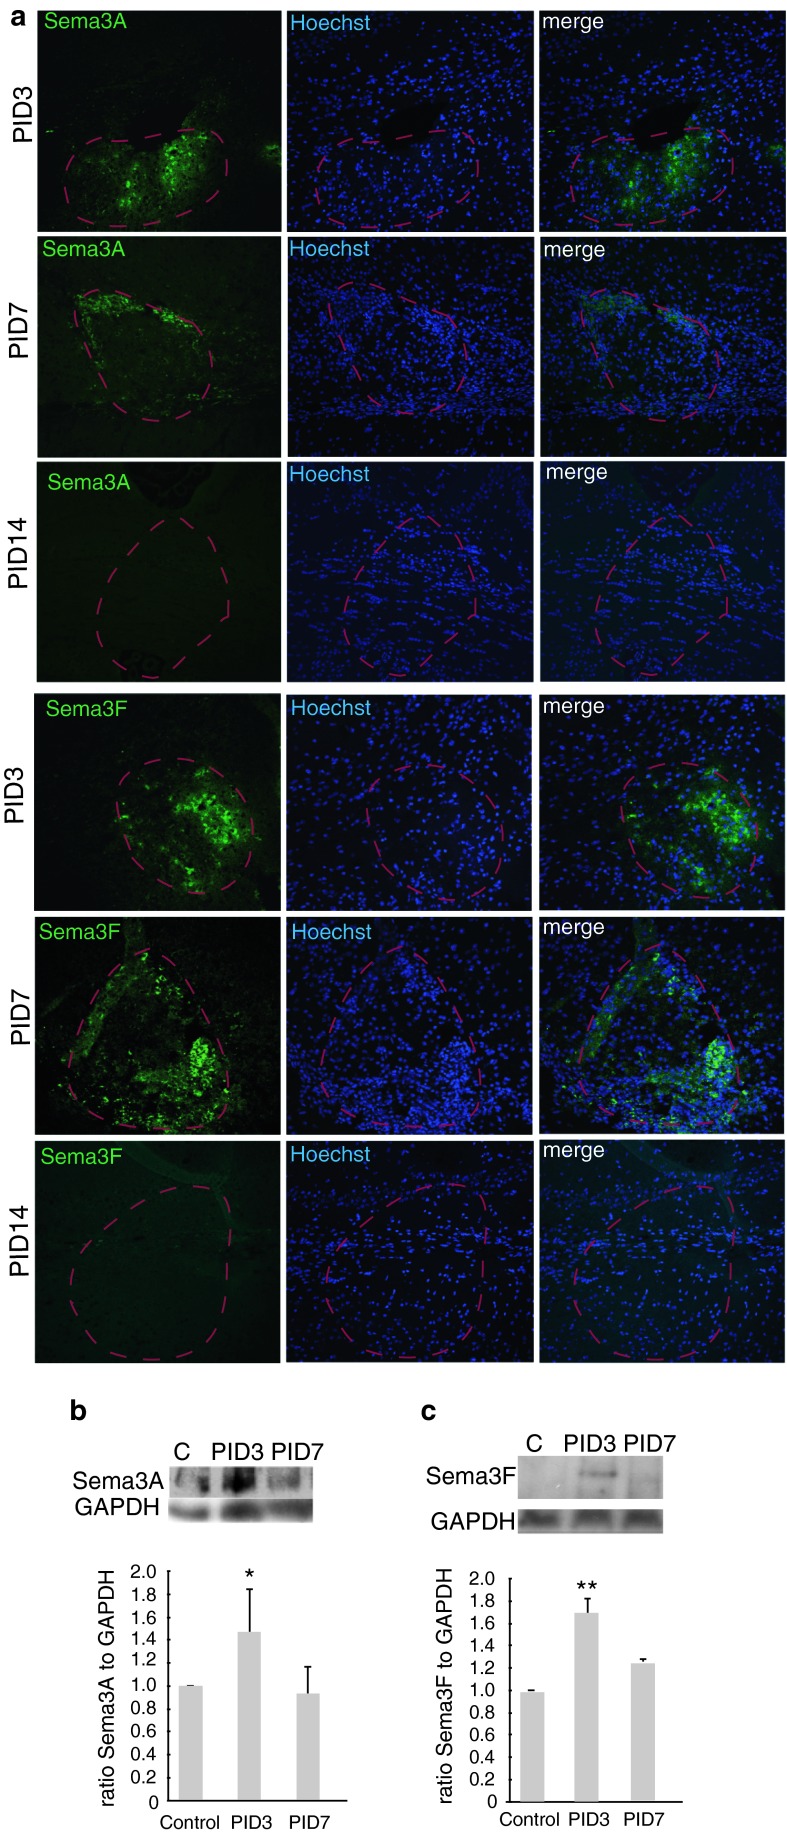
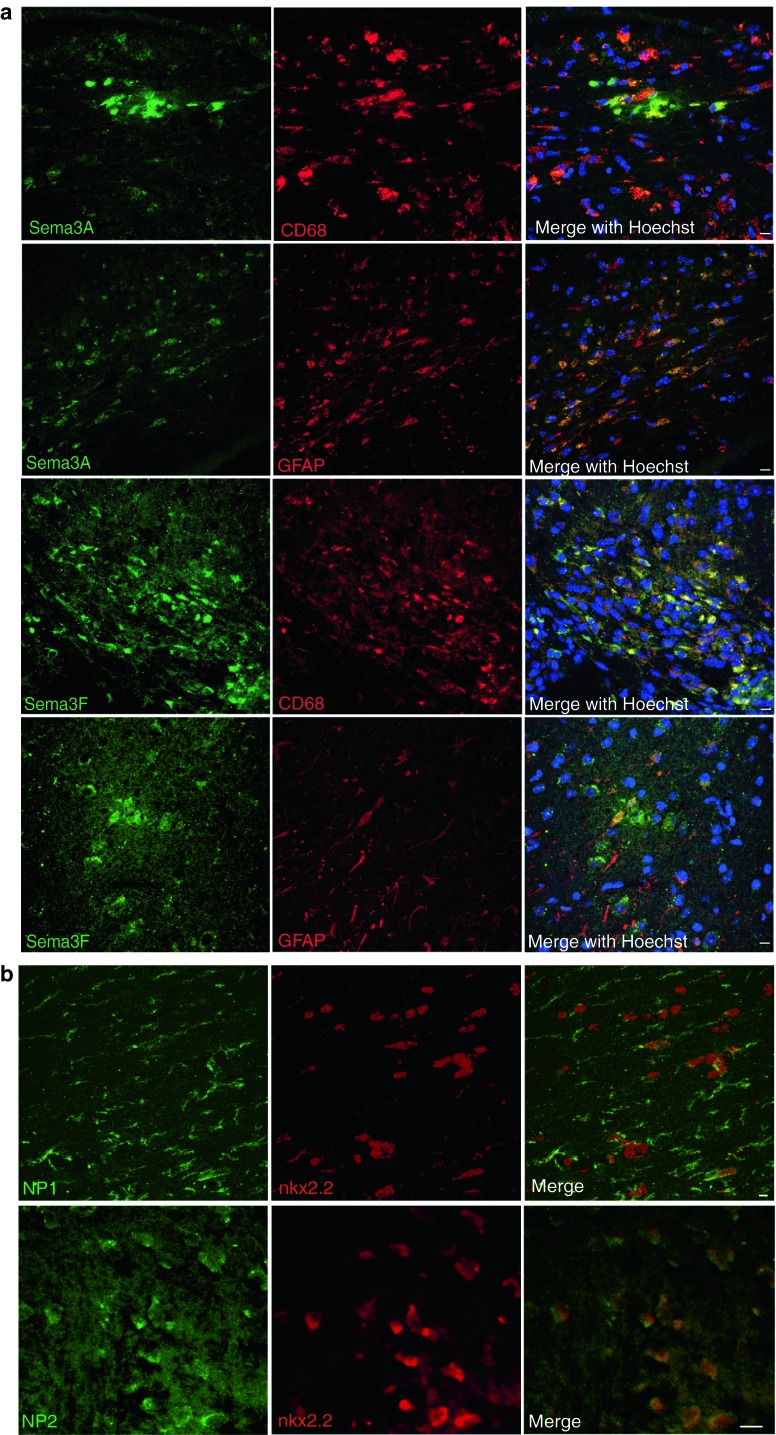
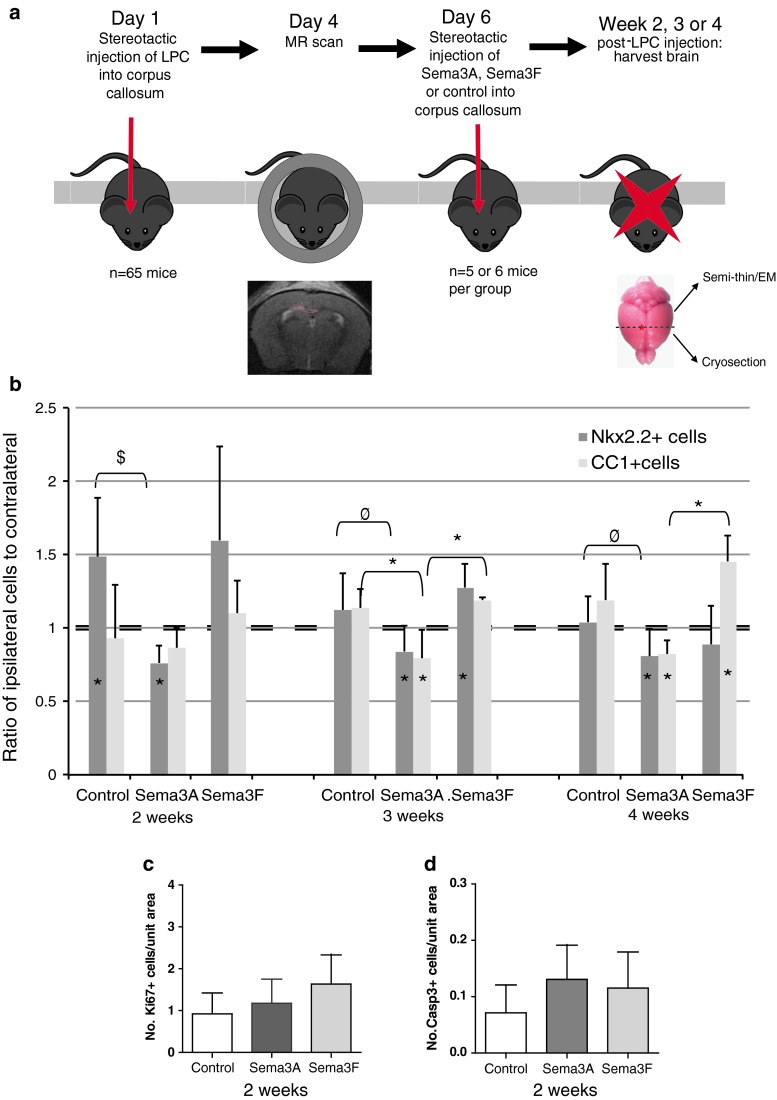
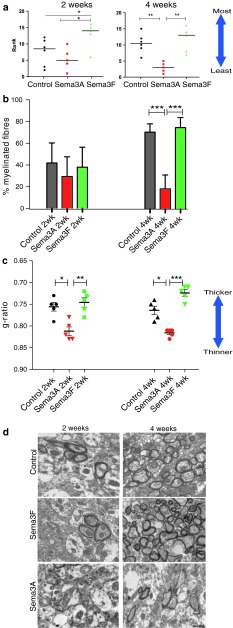
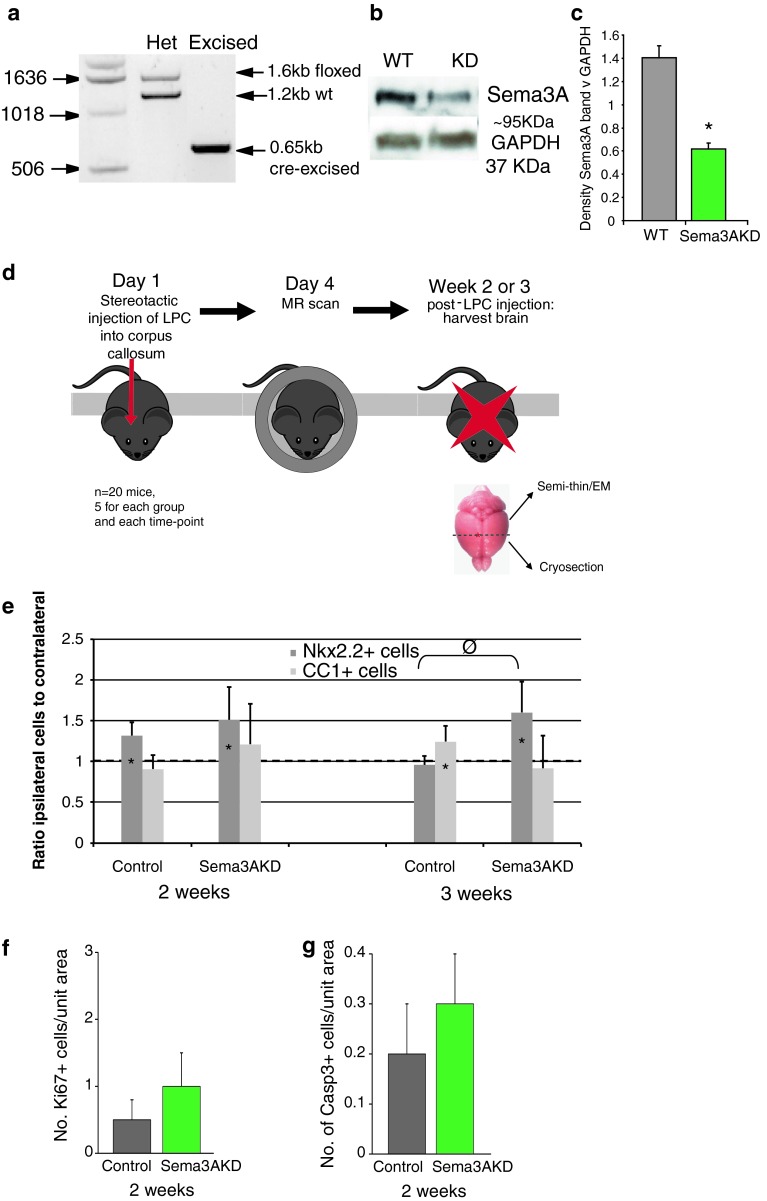
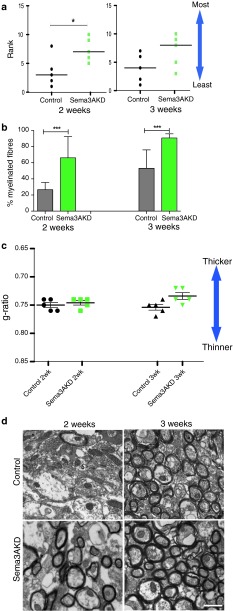
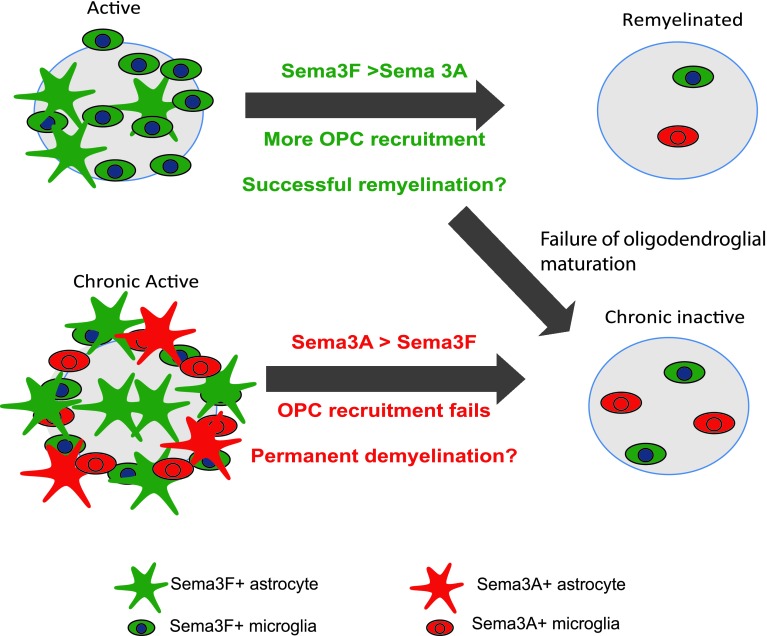
Failure of remyelination of multiple sclerosis (MS) lesions contributes to neurodegeneration that correlates with chronic disability in patients. Currently, there are no available treatments to reduce neurodegeneration, but one therapeutic approach to fill this unmet need is to promote remyelination. As many demyelinated MS lesions contain plentiful oligodendrocyte precursor cells (OPCs), but no mature myelinating oligodendrocytes, research has previously concentrated on promoting OPC maturation. However, some MS lesions contain few OPCs, and therefore, remyelination failure may also be secondary to OPC recruitment failure. Here, in a series of MS samples, we determined how many lesions contained few OPCs, and correlated this to pathological subtype and expression of the chemotactic molecules Semaphorin (Sema) 3A and 3F. 37 % of MS lesions contained low numbers of OPCs, and these were mostly chronic active lesions, in which cells expressed Sema3A (chemorepellent). To test the hypothesis that differential Sema3 expression in demyelinated lesions alters OPC recruitment and the efficiency of subsequent remyelination, we used a focal myelinotoxic mouse model of demyelination. Adding recombinant (r)Sema3A (chemorepellent) to demyelinated lesions reduced OPC recruitment and remyelination, whereas the addition of rSema3F (chemoattractant), or use of transgenic mice with reduced Sema3A expression increased OPC recruitment and remyelination. We conclude that some MS lesions fail to remyelinate secondary to reduced OPC recruitment, and that chemotactic molecules are involved in the mechanism, providing a new group of drug targets to improve remyelination, with a specific target in the Sema3A receptor neuropilin-1.

Trial registration: ClinicalTrials.gov NCT01244139.


Figures

Fig. 1
Fig. 1
Different human MS lesions contain different numbers of OPCs. Colorimetric staining of an active MS lesion showing a Olig2+ cells, b NogoA+ cells and c immunofluorescence showing dual labelling (Olig2 in green and NogoA in red). The thick arrow shows an Olig2+ cell and the thin arrow a dual labelled cell. Scale bar a and b 40 μm c 10 μm. d Bar graph of average OPC number per lesion area, with one bar per lesion, showing the variation between pathological subtypes, with fewer OPCs in the chronic active lesions. The normal range of numbers of OPC in the brain was defined as the mean ± one standard deviation of OPC counts from 35 fields of view from 5 blocks from 5 different postmortem brains where death was due to a non-neurological cause. e Schematic showing the variability of OPC number in different regions of single lesions represented as white (for demyelinated lesions) or pale grey areas (for remyelinated lesions) compared with white matter of control non-MS brain tissue. Red boxes represent fields of view counted, and 1 grey circle represents 10 OPCs
Fig. 2
Fig. 2
MS lesions with different pathology show different patterns of protein expression of Sema3A and 3F. In normal human brain grey matter, there is expression of Sema3A protein in neuronal cell bodies and some axons (a) and Sema3F (b) in neuronal cell bodies by colorimetric and immunofluorescence staining (green Sema3A/F labelling, red NeuN staining neuronal cell bodies). c Colorimetric staining shows patterns of staining in active, chronic active or chronic inactive MS lesions. There is absence of Sema3A staining, but florid Sema3F staining in active lesions, as compared to more chronic lesions, which express both proteins. Scale bars 10 μm. d Quantification of the number of cells in each type of MS lesion expressing Sema3A or Sema3F/unit area confirms that there are few cells in active lesions expressing Sema3A, but more expressing Sema3F, whereas in chronic active lesions, more cells express Sema3A compared with Sema3F, and chronic inactive and remyelinated lesions have few cells expressing either protein. e For each lesion, the number of cells expressing Sema3A or Sema3F is plotted against the average number of OPCs in the lesion, to identify a correlation. The normal range of number of OPCs is shown as defined as the mean ± one standard deviation of OPC counts from 35 fields of view from 5 blocks from 5 different postmortem brains where death was due to a non-neurological cause. An increase in number of cells expressing Sema3A correlates with fewer OPCs found in the lesion, whereas the relationship is less clear with Sema3F. f Graph showing numbers of cells expressing Sema3A or Sema3F and the average number of OPCs in each lesion, separated by pathological subtype. The normal range of OPC number is marked, as described above. Although there is variability between lesions, if the lesion contains more Sema3A-expressing cells (red), the OPC number is lower, and high numbers of OPCs are only present if the number of Sema3A-expressing cells is low
Fig. 3
Fig. 3
Astrocytes and microglia/macrophages express Sema3A, 3F in MS brain, and oligodendroglial cells express their receptors a Astrocytes (GFAP-labelled) and microglia/macrophages (CD68-labelled) in chronic active lesions express Sema3A. Astrocytes and microglia/macrophages in active and chronic active lesions express Sema3F (active lesion shown) b NP1 and NP2 are expressed in oligodendroglial cells (Nkx2.2-labelled) (chronic active lesions shown). Examples of double-positive cells are labelled with arrows. Pictures are flattened confocal stacks. White boxes indicate location of magnified picture. High background staining is found in this human postmortem tissue and is most obvious in the NP2 photographs where the bright punctate staining is nonspecific. Scale bar 10 μm
Fig. 4
Fig. 4
Demyelination in our mouse model a typical demyelinated lesion shown by Luxol fast blue staining: demarcated by dashed line. Scale bar 100 μm. b Typical lesion shown by fluoromyelin green staining (composite photo)—demarcated by dashed line. Scale bar 200 μm. c Semi-thin section stained with toluidine blue showing a lesion, delineated with red dashed line, in the corpus callosum delineated with white dashed line. Scale bar 100 μm. Immunofluorescence staining of normal side (d) and lesioned side e of corpus callosum with antibodies against MBP (green), Olig2 (white), GFAP (red) and a merge with Hoechst to stain nuclei (blue). Scale bar 10 μm
Fig. 5
Fig. 5
Sema3A and 3F expression in our mouse model of demyelination. a Immunofluorescence for Sema3A or Sema3F in a mouse lesion at post-injection days (PID) 3, 7 and 14, with Sema3A or Sema3F (green), Hoechst to stain cell nuclei (blue) and a merge. The lesion is delineated by a red line. Scale bar 100 μm. Western blot analysis confirms this transient rise in expression for Sema3A (b) and Sema3F (c). C control unlesioned corpus callosum, PID 3,7 shown. GAPDH is loading control. Densitometry blots from 2 separate sets of animals for each, showing mean density ratio plus SD of Sema3A/F band to GAPDH band, with ratio in unlesioned tissue defined as 1 (*p < 0.05, **p < 0.01, t test, when compared with control)
Fig. 6
Fig. 6
Astrocytes and microglia/macrophages express Sema3A, 3F in demyelinated lesions in our mouse model, and oligodendroglial cells express their receptors a Astrocytes (GFAP-labelled) and microglia/macrophages (CD68-labelled) in demyelinated lesions at post-injection day 3 express Sema3A. b NP1 and NP2 are expressed in oligodendroglial cells (nkx2.2-labelled) at post-injection day 3. Pictures are flattened confocal stacks. Scale bar 10 μm
Fig. 7
Fig. 7
Manipulation of Sema3A or Sema3F levels in the mouse model in vivo changes OPC migration to the lesion. a Timeline for experiment. b More nkx2.2+ oligodendroglial cells are present around and within lesions treated with rSema3F and less around lesions treated with rSema3A as compared to the unlesioned sides at 2 and 3 weeks after the lesion. More CC1+ oligodendrocytes are present around and within lesions treated with rSema3F and less around lesions treated with rSema3A as compared to the unlesioned side at 3 and 4 weeks after the lesion (mean ratio + SD asterisks on bars indicate value is significantly different as compared to contralateral side (assigned value of 1), symbols above bars indicate significant differences between groups *p < 0.05, $ p < 0.001, φ p < 0.01, comparing treatments by ANOVA and Tukey’s post test). There is no difference in proliferation (Ki67+ cells) c or apoptosis (cleaved caspase-3+ cells) d within the lesion between the groups at 2 weeks (mean + SD, n > 20 sections from 5 mice per group)
Fig. 8
Fig. 8
Manipulation of Sema3A or Sema3F levels in the mouse model in vivo changes remyelination efficiency. a Blinded ranking of remyelination shows improved remyelination with addition of rSema3F and an inhibition of remyelination with addition of rSema3A to the lesion. Horizontal line represents median (**p < 0.01 and *p < 0.05 using 1-way ANOVA and Tukey’s post test.) b Graph of percentage of myelinated fibres in each group, counted from 10 fields of view per animal, and at least 500 fibres per group. This shows that there is no difference between the number of fibres myelinated at 2 weeks, but there is a clear difference at 4 weeks, with no increase in myelinated fibres in the Sema3A-treated group over this time. In contrast, the number of myelinated fibres returns to normal levels for the corpus callosum in control and Sema3F-treated animals (mean ± SEM ***p < 0.001, **p < 0.01 and *p < 0.05 using 1-way ANOVA and Tukey’s post test). c Graph showing that the average g-ratio per animal in each group is significantly higher in Sema3A-treated animals at both time points, indicating thinner myelin than in the other two groups. Sema3F-treated animals have a trend to thicker myelin by 4 weeks (lower g-ratio). Note that the y-axis is inverted and does not start at zero, so that the graphs in a, b and c can be directly compared (mean ± SEM ***p < 0.001, **p < 0.01 and *p < 0.05 using 1-way ANOVA and Tukey’s post test). d Electron microscope photographs through lesions. Scale bar 1 μm
Fig. 9
Fig. 9
Transgenic knockdown of Sema3A increases recruitment of OPCs after demyelination in vivo. a PCR shows presence of Cre-excised band in Sema3AKD mice. b Western blot shows reduced levels of Sema3A protein in Sema3AKD mice (GAPDH as loading control). c Densitometry measurements of three western blots shows a significant (p < 0.001, t test) reduction in Sema3A protein expression as compared to GAPDH expression, of around 60 %. d Strategy for in vivo experiment. e More nkx2.2+ oligodendroglial cells are present around and within lesions in Sema3AKD mice as compared to the unlesioned side at 2 and 3 weeks after the lesion. CC1+ oligodendroglial cells are relatively unchanged around and within lesions in Sema3AKD mice as compared to the unlesioned side at 2 and 3 weeks after the lesion, suggesting that by these time points CC1+ number has already reached normal, correlating with remyelination of around 60 % of fibres already by 2 weeks (see Fig. 10b) (mean ratio + SD asterisks on bars indicate value is significantly different as compared to contralateral side (assigned value of 1), symbols above bars indicate significant differences between groups *p < 0.05, φ p < 0.01, comparing treatments by ANOVA and Tukey’s post test). f There is no difference in proliferation (Ki67+ cells) or apoptosis (CC1+ cells) (g) within the lesion between the groups at 2 weeks after injection (Mean + SD, n > 20 sections from 5 mice per group)
Fig. 10
Fig. 10
Transgenic knockdown of Sema3A in vivo changes remyelination efficiency. a Blinded ranking of remyelination shows more remyelination in Sema3AKD mice at 2 weeks compared to controls. Horizontal line represents median. *p < 0.05 using 1-way ANOVA and Tukey’s post test. b Graph of percentage of myelinated fibres in each group, counted from 10 fields of view per animal, and at least 500 fibres per group. This shows that there is an increase in the number of fibres myelinated at both time points in the Sema3AKD group (mean ± SEM ***p < 0.001 using 1-way ANOVA and Tukey’s post test). c Graph showing that the average g-ratio per animal in each group is not significantly different in Sema3AKD animals at either time point, however, Sema3AKD mice (similarly to Sema3F-treated mice, see Fig. 8c) have a trend to thicker myelin by 3 weeks (lower g-ratio). Note that the y axis is inverted and does not start at zero, so that the graphs in a, b and c can be directly compared (mean ± SEM using 1-way ANOVA and Tukey’s post test). d Electron microscope photographs through lesions. Scale bar 1 μm
Fig. 11
Fig. 11
Model summarizing Sema3A and Sema3F expression in different pathological subtypes of MS lesions and correlation with success or failure of OPC recruitment and subsequent remyelination

Similar articles

Cited by

References

    1. Behar O, Golden JA, Mashimo H, Schoen FJ, Fishman MC. Semaphorin III is needed for normal patterning and growth of nerves, bones and heart. Nature. 1996;383(6600):525–528. doi: 10.1038/383525a0. - DOI - PubMed
    1. Caillava C, Vandenbosch R, Jablonska B, Deboux C, Spigoni G, Gallo V, Malgrange B, Baron-Van Evercooren A. Cdk2 loss accelerates precursor differentiation and remyelination in the adult central nervous system. J Cell Biol. 2011;193(2):397–407. doi: 10.1083/jcb.201004146. - DOI - PMC - PubMed
    1. Carbajal KS, Miranda JL, Tsukamoto MR, Lane TE. CXCR4 signaling regulates remyelination by endogenous oligodendrocyte progenitor cells in a viral model of demyelination. Glia. 2011;59(12):1813–1821. doi: 10.1002/glia.21225. - DOI - PMC - PubMed
    1. Catalano SM, Messersmith EK, Goodman CS, Shatz CJ, Chedotal A. Many major CNS axon projections develop normally in the absence of semaphorin III. Mol Cell Neurosci. 1998;11(4):173–182. doi: 10.1006/mcne.1998.0687. - DOI - PubMed
    1. Chang A, Nishiyama A, Peterson J, Prineas J, Trapp BD. NG2-positive oligodendrocyte progenitor cells in adult human brain and multiple sclerosis lesions. J Neurosci. 2000;20(17):6404–6412. - PMC - PubMed

Publication types

MeSH terms

Associated data