. 2013 Apr 17;33(16):6990-7002.
doi: 10.1523/JNEUROSCI.4998-12.2013.

Acute suppression of spontaneous neurotransmission drives synaptic potentiation

Affiliations

Acute suppression of spontaneous neurotransmission drives synaptic potentiation

Elena Nosyreva et al. J Neurosci. .

Abstract

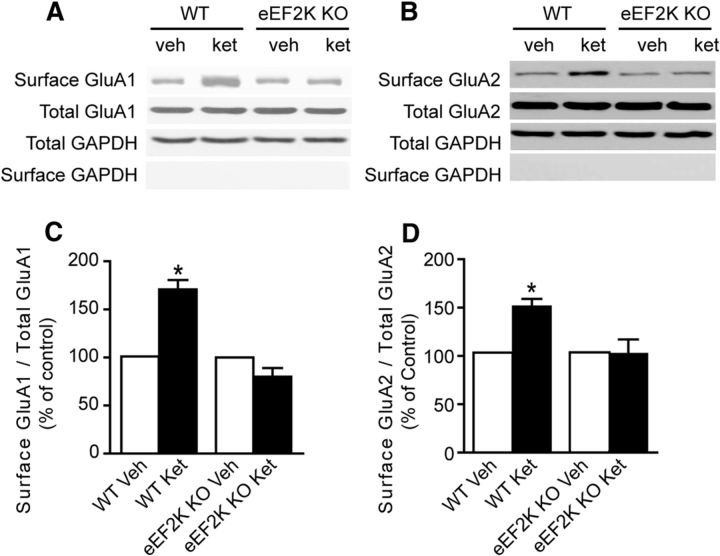
The impact of spontaneous neurotransmission on neuronal plasticity remains poorly understood. Here, we show that acute suppression of spontaneous NMDA receptor-mediated (NMDAR-mediated) neurotransmission potentiates synaptic responses in the CA1 regions of rat and mouse hippocampus. This potentiation requires protein synthesis, brain-derived neurotrophic factor expression, eukaryotic elongation factor-2 kinase function, and increased surface expression of AMPA receptors. Our behavioral studies link this same synaptic signaling pathway to the fast-acting antidepressant responses elicited by ketamine. We also show that selective neurotransmitter depletion from spontaneously recycling vesicles triggers synaptic potentiation via the same pathway as NMDAR blockade, demonstrating that presynaptic impairment of spontaneous release, without manipulation of evoked neurotransmission, is sufficient to elicit postsynaptic plasticity. These findings uncover an unexpectedly dynamic impact of spontaneous glutamate release on synaptic efficacy and provide new insight into a key synaptic substrate for rapid antidepressant action.


Figures

Figure 1.
Figure 1.
Ketamine application at rest potentiates subsequent AMPAR-mediated evoked neurotransmission. A, FPs were recorded in control (n = 6) and ketamine-treated (20 μm) (n = 12) slices. Initial FP slopes are plotted as a function of time (mean ± SEM). Inset, Representative waveforms from control and ketamine-treated slices recorded at different time points (1, 2). The line with the asterisk indicates the area of significant change. One-way ANOVA with repeated measurements, F(121,853) = 2.4, p = 0.001; with Holm-Sidak post hoc test, p < 0.05. Scale bar, 0.2 mV/5 ms. B, Left, NMDAR FPs as a function of time (mean ± SEM). Ketamine was applied after baseline for 30 min at rest, followed with a train of 200 stimuli at 1 Hz, and 20 stimuli at 20 Hz, in the presence of ketamine (n = 6). NMDAR FPs were recorded in solution containing the following: 124 mm NaCl, 2 mm KCl, 3 mm CaCl2, 0.1 mm MgCl2, 10 mm glucose, 1.2 mm NaH2PO4, 26 mm NaHCO3, 10 μm glycine, 20 μm DNQX, 50 μm picrotoxin. Right, Representative traces of NMDAR FP recorded during baseline (1), at the end of 1 Hz train (2), and during 20 Hz stimulation (3). C, Different protocol of ketamine application (see Materials and Methods). FP initial slopes from control (n = 5) and ketamine-treated slices (n = 9) are plotted as a function of time (mean ± SEM). Inset, Representative waveforms from ketamine-treated slices at different time points (1, 2). Synaptic strength increases significantly in ketamine-treated slices, compared with control slices. One-way ANOVA with repeated measurements, F(10,65) = 7.3, p = 0.001; with Holm-Sidak post hoc test, p < 0.05. Scale bar, 0.2 mV/5 ms. D, Paired-pulse facilitation. Plotted are FP2/FP1 ratios recorded during baseline (1) and after ketamine application (2) as a function of ISI (mean ± SEM). Inset, Representative traces: 0 FP1 followed by FP2 with 20, 50, 200, and 500 ms ISI. No significant changes were observed in these experiments (n = 9). Scale bar, 0.2 mV/5 ms. E, Input–output curves measured during baseline (1) and after ketamine washout (2). Plotted are FP initial slopes (mean ± SEM) as a function of presynaptic volley values at 5, 10, 15, 20, and 25 μA stimulation intensity. The slope of the input–output curve after ketamine treatment (2) is significantly different from the slope measured during baseline (1); (t test, p < 0.05) (n = 9). Inset, Representative FP trace. F, Plotted are FP initial slopes (mean ± SEM) from control slices (n = 5) and slices treated with 10 μm MK801 (n = 5) as a function of time. Inset, Representative waveforms from MK801-treated slices at different time points (1, 2). Synaptic strength increases significantly in MK801-treated slices while no changes are observed in control slices (Control no drug). One-way ANOVA with repeated measurements, F(37,151) = 2.75, p = 0.001; with Holm-Sidak post hoc test, p < 0.05. Scale bar, 0.2 mV/5 ms. G, FPs elicited by paired-pulse stimulation with ISI of 20, 30, 50, 100, 200, 300, 400, and 500 ms during the baseline (open circles) and after MK801 washout (open squares). Plotted are FP2/FP1 ratios (± SEM) as a function of interpulse interval. Inset, Representative traces: 0 FP1 followed by FP2 with 20, 50, 200, and 500 ISI. No significant changes were observed in these experiments (n = 5). Scale bar, 0.2 mV/5 ms. H, Input–output curves measured during baseline (1) and after MK801 washout (2). Plotted are FP initial slopes as a function of presynaptic volley values (mean ± SEM) at 5, 10, 15, 20, and 25 μA stimulation intensity. The slope of input–output curve after MK801 treatment is significantly different from the slope without MK801 treatment (t test, p = 0.02; n = 5). Inset, Representative FP trace. I, Left, Plotted are NMDAR FP initial slopes before and after ketamine treatment as a function of time (mean ± SEM). After application of ketamine and 1 h washout, no significant changes in synaptic strength were observed. One-way ANOVA with repeated measurements, F(1,60) = 14.1, p = 0.4 (n = 5). Right, Representative traces of NMDAR FP recorded at different time points (1, 2, 3). J, Input–output curves for NMDAR FP measured during baseline (1) and after ketamine washout (3). Plotted are FP initial slopes as a function of presynaptic volley values (mean ± SEM) at 10, 20, 30, and 40 μA stimulation intensity. There is no significant change in the slope of input–output curves before and after ketamine treatment (p = 0.44; n = 5).
Figure 2.
Figure 2.
Ketamine-mediated synaptic potentiation occurs in the absence of activity but depends on protein synthesis and BDNF expression. A, Plotted are FP initial slopes after ketamine and TTX treatment as a function of time (mean ± SEM). Inset, Representative waveforms at different time points (1, 2). Synaptic strength increases significantly after treatment with ketamine plus TTX. One-way ANOVA with repeated measurements, F(23,167) = 6.16, p = 0.001; with Holm-Sidak post hoc test, p < 0.05; n = 7. Scale bar, 0.2 mV/5 ms. B, Input–output curves measured during baseline (1) and after ketamine plus TTX washout (2). Plotted are FP initial slopes as a function of presynaptic volley values at 5, 10, 15, 20, and 25 μA stimulation intensity (mean ± SEM). The slope of input–output curve after ketamine plus TTX treatment is significantly different from the slope measured during baseline (t test, p = 0.01; n = 7). C, Plotted are FP initial slopes after TTX treatment as a function of time (mean ± SEM). Inset, Representative waveforms from TTX-treated slices at different time points (1, 2). There is no significant change in synaptic strength after application of TTX. Scale bar, 0.2 mV/5 ms; n = 5. D, Input–output curves measured during baseline (1) and after TTX washout (2). Plotted are FP initial slopes as a function of presynaptic volley values at 5, 10, 15, 20, and 25 μA stimulation intensity (mean ± SEM). There is no significant change in the slope of input–output curve after application of TTX (n = 5). E, F, Application of anisomycin (20 μm) for the whole length of the experiment blocks synaptic potentiation induced by ketamine (n = 9) or MK801 (n = 5). Plotted are FP initial slopes as a function of time (mean ± SEM). Inset, Representative waveforms from ketamine-treated (E) and MK801-treated (F) slices at different time points (1, 2). G, H, Plotted are average values of FP initial slopes (mean ± SEM) measured during baseline at 30 min of ketamine and MK801 application and after 1 h of washout. Black bars (G) and white bars (H) are experiments from Fig. 1C,F (C, ketamine; F, MK801). Yellow bars, Ketamine or MK801 in presence of anisomycin (Fig. 2E,F). Scale bar, 0.2 mV/5 ms (G, n = 6; H, n = 5). Both ketamine and MK801 induce significant facilitation in synaptic strength, anisomycin abolishes this effect. I, In wild-type (WT) slices (n = 5), ketamine induced synaptic strength facilitation. In contrast, no changes were observed in slices from inducible BDNF knock-out mice after application of ketamine (n = 9). Plotted are FP initial slopes as a function of time (mean ± SEM). Inset, Representative waveforms from WT and inducible BDNF knock-out (KO) slices, recorded at different time points (1, 2). Synaptic strength increases significantly in WT ketamine-treated slices but not in slices from the BDNF KO. One-way ANOVA with repeated measurements, F(56,227) = 2.55, p = 0.001; with Holm-Sidak post hoc test, p < 0.05. Scale bar, 0.2 mV/5 ms.
Figure 3.
Figure 3.
Behavioral characterization reveals no gross phenotypic alterations in adult male mice after loss of eEF2 kinase. A, Analysis of locomotion over a 2 h period reveals no significant difference in locomotor activity between wild-type (WT) littermates and eEF2K knock-outs (KOs) (n = 8–10/group) measured either in 5 min increments or in the amount of total activity over a 2 h test period (inset). B, Open-field analysis demonstrates no alterations in anxiety-related behavior between WT littermate controls and eEF2K KOs (n = 8–10/group) in time spent in the center or periphery of the arena. C, Elevated plus maze activity shows equivalent behavior between WT littermates and eEF2 kinase KOs (n = 8–10/group) in exploration of the closed arm and the open arm. D, Activity in a light/dark chamber shows that WT littermates and eEF2K KOs (n = 8–10/group) display comparable movement in each chamber. E, In an interaction chamber, control littermates and eEF2 kinase KOs (n = 8–10/group) show no significant differences in time spent with an empty cage or with a social target.
Figure 4.
Figure 4.
The acute antidepressant-like effects of ketamine requires eEF2 kinase activity. A, B, Immunoblot analysis of phospho-eEF2 and total eEF2 expression in total protein lysates from prefrontal cortex or hippocampus in eEF2 kinase knock-outs (KOs) or wild-type (WT) littermate controls reveals that phosphorylation of eEF2 is negligible after loss of eEF2 kinase (cortex, p = 0.0054; hippocampus, p = 0.0005) (n = 5/group). C, Immunoblot analysis of BDNF expression in WT mice and their eEF2 kinase KO littermates treated for 30 min with vehicle or ketamine (5 mg/kg) illustrates that BDNF expression does not increase in hippocampus after acute ketamine treatment in eEF2 kinase KO mice (p = 0.138) (n = 4/group). D, Acute ketamine treatment (30 min; 5 mg/kg) decreases immobility in WT animals compared with vehicle-treated mice in the forced swim test. In contrast, their eEF2K KO littermates do not respond to application of ketamine (ANOVA F(1,25) = 4.530, Tukey's post hoc test, p < 0.05; n = 7–8 group). E, eEF2 kinase KO mice do not show rapid antidepressant responses to ketamine administration in the novelty suppressed feeding (NSF) paradigm. WT control mice and their eEF2K KO littermates were administered vehicle or ketamine (5.0 mg/kg) intraperitoneally. In NSF test, latency to feed was recorded 30 min after ketamine injection. Ketamine-treated WT control mice show decreased latency to feed (ANOVA, F(3,29) = 6.487, p = 0.0017 for treatment; with Tukey's post hoc, p < 0.05); whereas ketamine-treated eEF2K KO animals show no change in latency to acquire food. F, Post-test for the 30 min NSF test demonstrating that all groups show comparable appetites.
Figure 5.
Figure 5.
Ketamine-mediated synaptic potentiation requires eEF2 kinase activity. A, D, Plotted are FP initial slopes as a function of time (mean ± SEM) from wild-type (WT) (n = 6) and eEF2K knock-out (KO) (n = 7) mice slices treated with ketamine. Inset, Representative waveforms from ketamine-treated slices during different time points (1, 2). Synaptic strength increases significantly in ketamine-treated slices from WT mice, but not in eEF2K KO mice. One-way ANOVA with repeated measurements, F(16,101) = 10.9, p = 0.001; with Holm-Sidak post hoc test, p < 0.05. Scale bar, 0.2 mV/5 ms. B, E, Paired-pulse facilitation. FPs elicited by paired-pulse stimulation in slices from WT and eEF2K KO mice, during the baseline (1) and after ketamine washout (2). Plotted are FP2/FP1 ratios as a function of ISI (mean ± SEM). No significant changes were observed in these experiments. Scale bar, 0.2 mV/5 ms. C, F, Input–output curves measured in slices from WT and eEF2K KO mice during baseline (1) and after ketamine washout (2). Plotted are FP initial slopes as a function of presynaptic volley values at 5, 10, 15, 20, and 25 μA stimulation intensity (mean ± SEM). The slope of input–output curve after ketamine treatment of WT slices increases significantly (C) (t test, p = 0.009). In the case of eEF2K KO, there is no change in the slope of input–output curve (F).
Figure 6.
Figure 6.
Ketamine-mediated synaptic potentiation requires GluA2 function. Biochemical measurements of surface expressed AMPARs in eEF2K knock-out (KO) mice after application of ketamine. Vehicle or ketamine (5.0 mg/kg) was administered intraperitoneally to wild-type (WT) and eEF2K KO animals. After 3 h, surface levels of GluA1 and GluA2 were assessed using a standard cell surface biotinylation procedure. A, C, Densitometric analysis of surface GluA1/total GluA1 ratios (normalized to control) 3 h after ketamine administration shows that ketamine increases surface GluA1 levels in control animals and has no effect on surface GluA1 levels in eEF2 KO animals (1-way ANOVA, F(3,14) = 22.50, p < 0.0001 for treatment; Tukey's post hoc test, p < 0.05; n = 5–6/group). B, D, Densitometric analysis of surface GluA2/total GluA2 ratios (normalized to control) 3 h after ketamine administration. Ketamine potentiates surface GluA2 levels in control animals and does not alter surface GluA2 levels in KO animals (1-way ANOVA, F(3,14) = 5.863, p = 0.0121; Tukey's post hoc test, p < 0.05; n = 5–6/group).
Figure 7.
Figure 7.
Ketamine-mediated synaptic potentiation requires GluA2 function. A, B, Application of NASPM does not reverse the effect of MK801 and ketamine on synaptic strength. After 20 min of stable baseline the drug was applied [A, ketamine (20 μm); B, MK801 (10 μm)] for 30 min at rest, then one control stimulus was applied, after which there was no stimulation during 1 h washout. Stimulation was resumed for 20 min after washout (ketamine, n = 5; MK801, n = 5). Application of NASPM (10 μm) followed. Plotted are FP initial slopes (mean ± SEM) as a function of time. A, Ketamine induced significant increase in synaptic strength (1-way ANOVA with repeated measurements, F(79,399) = 34.038, p = 0.001; with Holm-Sidak post hoc test, p < 0.05). Application of NASPM did not induce a decrease in synaptic strength. B, MK801 induced significant increase in synaptic strength (1-way ANOVA with repeated measurements, F(79,399) = 22.491, p = 0.001; with Holm-Sidak post hoc test, p < 0.05). Application of NASPM did not induce a decrease in synaptic strength. C, D, Application of DNQX in low concentration reverses the effect of ketamine and MK801. Ketamine and MK801 were applied as in A and B. Plotted are FP initial slopes (mean ± SEM) as a function of time. C, Ketamine induced significant increase in synaptic strength (1-way ANOVA with repeated measurements, F(1,247) = 730, p < 0.005; with Holm-Sidak post hoc test, p < 0.05. Application of low-dose (2 μm) DNQX reduced the synaptic potentiation seen after ketamine application (n = 5). D, MK801 induced significant increase in synaptic strength (1-way ANOVA with repeated measurements, F(1,314) = 3856, p < 0.001; with Holm-Sidak post hoc test, p < 0.05). Application of low-dose (2 μm) DNQX could again inhibit the synaptic potentiation seen after MK801 application (n = 5). E, Ketamine (20 μm) was applied to hippocampal slices from GluA2 knock-out (KO) mice and their wild-type (WT) littermates (WT, n = 5; GluA2 KO, n = 6). Plotted are FP initial slopes (mean ± SEM) as a function of time. Ketamine did not induce significant change in synaptic strength in slices from GluA2 KO mice, although in slices from WT littermates, significant increases in synaptic strength were observed after treatment with ketamine (1-way ANOVA with repeated measurements, F(1,319) = 20.21, p < 0,01; with Holm-Sidak post hoc test, p < 0.05). F, Input–output curves measured in slices from WT mice (n = 5) (open circles and squares) and from GluA2 KO mice (black circles and squares) at different time points (1, 2). The slope of input–output curve after ketamine treatment of WT slices is significantly different from the slope before ketamine treatment (n = 5, p < 0.05), but there is no significant change in input–output curve slope in slices from GluA2 KO animals (n = 6).
Figure 8.
Figure 8.
The acute antidepressant-like effects of ketamine is not manifested in GluA2 knock-out (KO) mice. A, The acute antidepressant-like effects of ketamine were examined at 30 min after intraperitoneal injection of either vehicle or ketamine (5.0 mg/kg) in wild-type (WT) and GluA2 KO mice using the forced swim test. Immobility in forced swim test is presented. Ketamine induces significantly less immobility in WT mice (ANOVA, F(3,19) = 18.88, p < 0.0001; Tukey's post hoc, p < 0.005; n = 9–10/group). Ketamine does not alter immobility in the GluA2 KO mice. B, C, WT and GluA2 KO animals were administered ketamine (5.0 mg/kg) or vehicle intraperitoneally. B, In novelty suppressed feeding (NSF) test 30 min after drug application, ketamine-treated WT mice show significantly decreased latency to feed (ANOVA, F(3,23) = 3.439, p = 0.0365; with Tukey's post hoc test, p < 0.05), whereas ketamine-treated GluA2 KO animals show no change in latency to acquire food. C, Post-test for the 30 min NSF test demonstrating that all groups show comparable appetite.
Figure 9.
Figure 9.
Selective suppression of spontaneous release via application of folimycin at rest is sufficient to elicit eEF2 kinase-dependent synaptic potentiation. A, Experimental design for whole-cell recordings in the presence of folimycin. B, C, Representative traces of evoked (B) and spontaneous (C) postsynaptic currents during different stages of the experiment (1, 2, 3). B, Recording evoked neuronal activity in dissociated hippocampal cultures for 4 min in Tyrode's solution (1), in presence of 10 μm TTX and 80 nm folimycin for 30 min (2), and after TTX washout (3). C, Recording spontaneous neuronal activity (mEPSC) in dissociated hippocampal cultures 10 min after application of TTX and folimycin (2), 30 min after application of TTX and folimycin (2), and after TTX washout (3). D, mEPSC frequency is significantly reduced in the presence of folimycin with or without TTX (n = 5, p < 0.001; mean ± SEM). E, Immunoblot analysis of phospho-eEF2 and total-eEF2 proteins in total protein lysates from dissociated hippocampal cultures indicates that the level of eEF2 phosphorylation in cultures treated with folimycin or ketamine is significantly decreased compared with control cultures treated with vehicle (n = 5, p < 0.02). Plotted are phospho-eEF2/total eEF2 ratios as percentage of control. F, FPs were recorded in eEF2K knock-out (KO) mice and in wild-type (WT) littermate control mice. In WT slices (filled circles, n = 5), folimycin induced synaptic strength facilitation. In contrast, no changes were observed in slices from eEF2K KO mice after application of folimycin (n = 9). Plotted are FP initial slopes (mean ± SEM) as a function of time. Inset, Representative waveforms from WT and eEF2K KO slices, recorded at different time points (1, 2). One-way ANOVA with repeated measurements, F(39,157) = 2.85, p = 0.001; with Holm-Sidak post hoc test, p < 0.05. Scale bar, 0.2 mV/5 ms.

References

    1. Aoto J, Nam CI, Poon MM, Ting P, Chen L. Synaptic signaling by all-trans retinoic acid in homeostatic synaptic plasticity. Neuron. 2008;60:308–320. doi: 10.1016/j.neuron.2008.08.012. - DOI - PMC - PubMed
    1. Atasoy D, Ertunc M, Moulder KL, Blackwell J, Chung C, Su J, Kavalali ET. Spontaneous and evoked glutamate release activates two populations of NMDA receptors with limited overlap. J Neurosci. 2008;28:10151–10166. doi: 10.1523/JNEUROSCI.2432-08.2008. - DOI - PMC - PubMed
    1. Autry AE, Adachi M, Nosyreva E, Na ES, Los MF, Cheng PF, Kavalali ET, Monteggia LM. NMDA receptor blockade at rest triggers rapid behavioural antidepressant responses. Nature. 2011;475:91–95. doi: 10.1038/nature10130. - DOI - PMC - PubMed
    1. Berman RM, Cappiello A, Anand A, Oren DA, Heninger GR, Charney DS, Krystal JH. Antidepressant effects of ketamine in depressed patients. Biol Psychiatry. 2000;47:351–354. doi: 10.1016/S0006-3223(99)00230-9. - DOI - PubMed
    1. Chung HJ, Xia J, Scannevin RH, Zhang X, Huganir RL. Phosphorylation of the AMPA receptor subunit GluR2 differentially regulates its interaction with PDZ domain-containing proteins. J Neurosci. 2000;20:7258–7267. - PMC - PubMed

Publication types

MeSH terms