. 2013 Apr 17;33(16):7066-78.
doi: 10.1523/JNEUROSCI.5206-12.2013.

Molecular mechanism of constitutive endocytosis of Acid-sensing ion channel 1a and its protective function in acidosis-induced neuronal death

Affiliations

Molecular mechanism of constitutive endocytosis of Acid-sensing ion channel 1a and its protective function in acidosis-induced neuronal death

Wei-Zheng Zeng et al. J Neurosci. .

Abstract

Acid-sensing ion channels (ASICs) are proton-gated cation channels widely expressed in the peripheral and CNSs, which critically contribute to a variety of pathophysiological conditions that involve tissue acidosis, such as ischemic stroke and epileptic seizures. However, the trafficking mechanisms of ASICs and the related proteins remain largely unknown. Here, we demonstrate that ASIC1a, the main ASIC subunit in the brain, undergoes constitutive endocytosis in a clathrin- and dynamin-dependent manner in both mouse cortical neurons and heterologous cell cultures. The endocytosis of ASIC1a was inhibited by either the small molecular inhibitor tyrphostin A23 or knockdown of the core subunit of adaptor protein 2 (AP2) μ2 using RNA interference, supporting a clathrin-dependent endocytosis of ASIC1a. In addition, the internalization of ASIC1a was blocked by dominant-negative dynamin1 mutation K44A and the small molecular inhibitor dynasore, suggesting that it is also dynamin-dependent. We show that the membrane-proximal residues (465)LCRRG(469) at the cytoplasmic C terminus of ASIC1a are critical for interaction with the endogenous adaptor protein complex and inhibition of ASIC1a internalization strongly exacerbated acidosis-induced death of cortical neurons from wild-type but not ASIC1a knock-out mice. Together, these results reveal the molecular mechanism of ASIC1a internalization and suggest the importance of endocytic pathway in functional regulation of ASIC1a channels as well as neuronal damages mediated by these channels during neurodegeneration.


Figures

Figure 1.
Figure 1.
ASIC1a undergoes constitutive internalization. A, Internalization of ASIC1a expressed in CHO cells. HA-ASIC1a-GFP expressed on the surface of CHO cells was labeled with a mouse anti-HA antibody and then allowed to internalize for 15, 30, or 60 min. Surface HA-ASIC1a (S) channels were labeled with a saturating concentration of AlexaFluor-594-conjugated secondary antibody. Internalized channels (I) were detected with AlexaFluor-546-conjugated secondary antibody after cell permeabilization. The edge of each cell was outlined by GFP fluorescence. Scale bar, 10 μm. B, The numbers of HA puncta per cell area (μm2) for both surface expressed and internalized channels were quantified and shown in the time course plots (mean ± SEM, n = 15–29 cells for each condition). C, Time course of internalization of native ASIC1a in cultured rat cortical neurons (DIV 10–12). Channels present on the cell surface were biotinylated and then allowed to internalize for the indicated times, after which the remaining surface biotin was stripped off. The internalized biotinylated ASIC1a was detected by precipitation of cell lysates using NeutrAvidin agarose, followed by immunoblotting (IB). Top, Representative Western blots of internalized (I) and total (T) ASIC1a. Bottom, Quantification of the ratio of internalized/total ASIC1a by fitting with a single exponential growth curve, which generated the time constant (τ) of ASIC1a internalization (7.0 ± 1.5 min, n = 4).
Figure 2.
Figure 2.
ASIC1a is associated with endocytic complex in the brain. A, Purified GST or GST-ASIC1a C terminus (ASIC1a-CT) was incubated with (+) or without (−) mouse brain extracts. Bound proteins were separated by SDS-PAGE and visualized via Coomassie blue staining. Arrow indicates the AP2 protein complex-containing band (∼110 kDa) that was reproducibly identified in three independent experiments. M, Molecular weight markers. B, Bands of interest from A were excised from the gel, trypsin-digested, and analyzed by matrix-assisted laser desorption/ionization time of flight mass spectrometry (MALDI-TOF-MS) analysis. MS sequencing of peptides (MW = 857.46, RGYIYWRL) from the indicated band identified AP2α2 (GenBank accession no. P17427) and AP2β1 (GenBank accession no. Q9DBG3). C, Co-IP results from cerebral cortices of WT and ASIC1a KO mice. CHC, AP2α, and AP2μ2 were detected by immunoblotting (IB) from immunoprecipitation by anti-ASIC1a antibody. No ASIC1a-positive band was detected from the KO lane, which validates the specificity of the ASIC1a antibody for biochemical experiments. Results are representatives of three independent experiments. D, ASIC1a is associated with the endocytic complex in subcellular fractionation from mouse cerebral cortices. Representative images of IB of subcellular fractions show the distribution profiles of indicated proteins. S1, Supernatant from homogenate centrifuged for 10 min at 800 × g, which represents the total soluble fraction; P2, pellet from S1 centrifuged for 15 min at 9200 × g, which represents the crude synaptosomal membranes; LP1, pellet from resuspended P2 centrifuged for 20 min at 25,000 × g, which represents the synaptosomal membranes. PSD fraction was isolated from LP1. Results are representatives of three independent experiments.
Figure 3.
Figure 3.
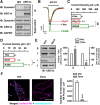
ASIC1a is mainly internalized by the clathrin-mediated pathway. A, The endocytosis of ASIC1a was inhibited by tyrphostin A23 (TyrA23). TfR was used as a positive control. Internalization assay was performed at 37°C for 15 min using CHO cells stably expressing GFP-ASIC1a (∼100 kDa). All the drugs were applied to the culture medium 30 min before the internalization assay. Vehicle (Veh): 0.35% (v/v) DMSO alone; TyrA23: 350 μm tyrphostin A23. I, Internalized; T, total; IB, immunoblotting. Right, Data are mean ± SEM of internalized/total based on band intensities and normalized to Veh-treated cells (hyphenated line). *p < 0.05 versus the corresponding Veh control (paired t test). ***p < 0.001 versus the corresponding Veh control (paired t test). n = 3 and 5 for ASIC1a and TfR, respectively. B, Representative blots showing that the shRNA construct effectively knocked down mouse AP2μ2 expression in transfected CHO cells. Cells were cotransfected with mCherry-AP2μ2 and shAP2μ2 or scrambled vector (Scr). Proteins were immunoblotted for AP2μ2 (∼80 kDa, mCherry-AP2μ2) and actin (∼45 kDa). C, Representative images of immunocytochemical staining of AP2μ2 (red) with anti-AP2μ2 antibody in mouse cortical neurons (DIV 7) that expressed shAP2μ2 or Scr vector for 2 d. Transfected cells were identified by the expression of GFP (green) included in the same vectors. The neuron that expressed shAP2μ2 showed a marked decrease in endogenous AP2μ2 staining (bottom) compared with the Scr-transfected neuron (top). Scale bar, 50 μm. D, Summary data for B and C normalized to intensity values of AP2μ2 in Scr-transfected cells obtained from immunoblotting (IB) or immunocytochemistry (ICC). Data represent mean ± SEM. ***p < 0.001. n = 6 for IB. *p < 0.05. n = 6 and 9 for Scr and shAP2μ2, respectively, for ICC. E, AP2μ2 knockdown increased proton (pH 6.0)-activated currents. Cultured mouse cortical neurons were transfected with shAP2μ2 or Scr at DIV 7, and proton-activated currents were recorded 2–3 d later. Left, Representative current traces for shAP2μ2 (red) or Scr (black) transfected neurons. Right, Summary data for proton-activated current density (mean ± SEM). *p < 0.05 (unpaired t test). n = 9 and 11 for Scr and shAP2μ2, respectively. F, Blockade of ASIC1a internalization by hypertonic treatment. The experiment was performed and quantified as that in Figure 1, A and B. Internalization of HA-ASIC1a-GFP expressed in CHO cells was allowed to proceed for 1 h in control or a hypertonic buffer (hypertonic, 0.45 m sucrose in the medium). The surface HA-ASIC1a was labeled by AlexaFluor-594 (magenta), whereas the internalized HA antibody was recognized by AlexaFluor-546 (cyan). Scale bar, 10 μm. Data at right represent mean ± SEM. ***p < 0.001 (unpaired t test). n = 23 and 25 for control and hypertonic, respectively.
Figure 4.
Figure 4.
ASIC1a is internalized by the dynamin-dependent pathway. A, Co-IP results from CHO cells cotransfected with GFP-ASIC1a (∼100 kDa) and GFP-dynamin1 (∼140 kDa) showing that dynamin1 was physically associated with ASIC1a. Results are representatives of three independent experiments. B, Proton-activated currents in CHO cells that coexpressed ASIC1a with GFP vector (+Vec, black), WT dynamin1 (+Dyn1, red), and DN dynamin1 K44A (+K44A, green), respectively. C, Summary for proton-activated current density in CHO cells transfected as in B. Data are mean ± SEM. *p < 0.05 versus Vec (ANOVA). ##p < 0.01, K44A versus Dyn1 (ANOVA). n.s., Not significant. n = 9, 8, and 13 for Vec, Dyn1, and K44A, respectively. D, Summary of proton-activated current density of cultured mouse cortical neurons transfected with GFP vector, WT dynamin1, or DN dynamin1 K44A at DIV 7–8 and recorded 1 d later. Data are mean ± SEM. *p < 0.05 versus Vec (ANOVA). #p < 0.05, K44A versus Dyn1 (ANOVA). n.s., Not significant. n = 7, 8, and 9 for Vec, Dyn1, and K44A, respectively. E, Dynasore blocked the endocytosis of GFP-ASIC1a stably expressed in CHO cells. Vehicle [Veh, 0.1% (v/v) DMSO alone] or dynasore (Dyna, 100 μm) was applied to the culture medium 30 min before the biotinylation assay. Surface expressed (S), internalized (I), and total (T) GFP-ASIC1a were determined as described in Materials and Methods. Right, Data are mean ± SEM of band intensity normalized to that of corresponding Veh controls. *p < 0.05 versus Veh (paired t test). n = 5 for surface biotinylation assay; n = 3 for biotinylated endocytosis assay. F, Dynasore blocked the endocytosis of ASIC1a in antibody feeding assay. The experiment was performed and quantified as that in Figure 1A, B. Internalization of HA-ASIC1a-GFP expressed in CHO cells was allowed to proceed for 1 h in the presence of Veh (0.1% DMSO) or dynasore (Dyna, 100 μm). The surface HA-ASIC1a was labeled by AlexaFluor-594 (magenta), whereas the internalized HA antibody was recognized by AlexaFluor-546 (cyan). Scale bar, 10 μm. Right, Data are mean ± SEM. ***p < 0.001 (unpaired t test). n = 13 and 10 for Veh and Dyna, respectively.
Figure 5.
Figure 5.
The C terminus of ASIC1a interacts with the endocytic complex. A, Diagram of cytoplasmic ASIC1a constructs fused to GST. The red characters at the N terminus of ASIC1a resemble the YXXØ endocytic motif. FL, Full-length; NT, N terminus; CT, C terminus. B, Interaction between ASIC1a-CT and the endocytic complex in mouse cerebral cortices. GST and GST-fusion proteins of ASIC1a-NT and ASIC1a-CT were incubated with (+) or without (−) cerebral cortex extracts in a GST pull-down assay. GST alone served as a negative control. Components of the endocytic complex (CHC, AP2α, and AP2μ2) were examined by immunoblotting (IB). PICK1 binding with the C terminus of ASIC1a served as a positive control. Results are representatives of three independent experiments.
Figure 6.
Figure 6.
The membrane-proximal residues of ASIC1a C terminus are critical for interaction with the endocytic complex. A, Left, Diagrams of various C-terminal deletion or mutation constructs fused with GST tag. Deleted regions are shown in gray. Right, Summary of binding results from B. +, ±, and − indicate strong, medium, and weak binding, respectively. B, Binding of AP2 complex with GST-fused deletion or mutation constructs of ASIC1a C terminus (CT). GST pull-down experiments were performed using GST-fusion proteins indicated and mouse cerebral cortex extracts, and immunoblotted for AP2α (top) and AP2μ2 (middle). GST fusion proteins were shown by Coomassie blue staining (bottom). Results are representative of three independent experiments. C, Similar GST pull-down assay as in B, but lysates from CHO cells expressing GFP-AP2μ2 were used. Shown are GFP-AP2μ2 (top) pulled down by the purified GST-fusion proteins and detected by IB using anti-GFP antibody. Comparable amounts of GST proteins (bottom) in cell lysates were detected by anti-GST antibody. D, Summary data for intensities of GFP-AP2μ2 bands normalized to that pulled down by WT ASIC1a-CT (hyphenated line) in C. Data represent mean ± SEM; n = 5. **p < 0.01 (ANOVA). ***p < 0.001 (ANOVA). E, Sequence alignment of different ASIC isoforms at the ASIC C termini and adjacent residues indicating that the 465LCRRG469 motif is present only in ASIC1a/1b of birds and mammals but not that of lower vertebrates or in other ASIC subunits. c, f, h, m, r, s, and z indicate chicken, toadfish, human, mouse, rat, shark, and zebrafish, respectively.
Figure 7.
Figure 7.
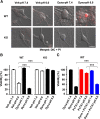
Inhibition of ASIC1a internalization enhances acidosis-induced death of mouse cortical neurons. A, Pretreatment with dynasore (Dyna, 100 μm, 30 min) enhanced neuronal death induced by acidosis (pH 6.0 for 1 and 24 h recovery, dynasore not present during the pH 6.0 treatment) in WT but not ASIC1a KO cortical neurons. Representative images of DIC and PI staining (red) for n ≥ 20 cells for each condition. Scale bar, 10 μm. B, Summary data of cell viability under conditions shown in A but measured using the CTB assay. Data represent mean ± SEM normalized to results obtained in Veh at pH 7.4. ***p < 0.001, from three different cultures for WT and ASIC1a KO cortical neurons with four repeats each time (unpaired t test). C, Differential effects of PcTX1 (0.2 μm, 30 min before and during acidosis) on acid-induced neuronal death without or with pretreatment of dynasore as in A and B. WT mouse cortical neurons were used. Data represent mean ± SEM of CTB assay results normalized to that of dynasore-treated neurons at pH 7.4. ***p < 0.001, from three independent cultures for WT mouse cortical neurons with four repeats each time (unpaired t test).
Figure 8.
Figure 8.
Model for the role of endocytic complex in ASIC1a internalization and its implication in neuronal death. The endocytosis of ASIC1a is driven by a noncanonical endocytic motif near the membrane via recruiting clathrin adaptor complex. Inhibition of dynamin-dependent endocytosis leads to membrane retention of ASIC1a and thus enhances acidosis-induced neuronal death. The downregulation in surface ASIC1a may contribute to neuronal protection during tissue acidosis associated with pathological conditions.

Similar articles

Cited by

References

    1. Arias RL, Sung ML, Vasylyev D, Zhang MY, Albinson K, Kubek K, Kagan N, Beyer C, Lin Q, Dwyer JM, Zaleska MM, Bowlby MR, Dunlop J, Monaghan M. Amiloride is neuroprotective in an MPTP model of Parkinson's disease. Neurobiol Dis. 2008;31:334–341. doi: 10.1016/j.nbd.2008.05.008. - DOI - PubMed
    1. Banbury DN, Oakley JD, Sessions RB, Banting G. Tyrphostin A23 inhibits internalization of the transferrin receptor by perturbing the interaction between tyrosine motifs and the medium chain subunit of the AP-2 adaptor complex. J Biol Chem. 2003;278:12022–12028. doi: 10.1074/jbc.M211966200. - DOI - PubMed
    1. Beattie EC, Carroll RC, Yu X, Morishita W, Yasuda H, von Zastrow M, Malenka RC. Regulation of AMPA receptor endocytosis by a signaling mechanism shared with LTD. Nat Neurosci. 2000;3:1291–1300. doi: 10.1038/81823. - DOI - PubMed
    1. Chai S, Li M, Branigan D, Xiong ZG, Simon RP. Activation of acid-sensing ion channel 1a (ASIC1a) by surface trafficking. J Biol Chem. 2010;285:13002–13011. doi: 10.1074/jbc.M109.086041. - DOI - PMC - PubMed
    1. Chen X, Gründer S. Permeating protons contribute to tachyphylaxis of the acid-sensing ion channel (ASIC) 1a. J Physiol. 2007;579:657–670. doi: 10.1113/jphysiol.2006.120733. - DOI - PMC - PubMed

Publication types

MeSH terms

LinkOut - more resources