

Cyclooxygenase-2-derived prostaglandin E₂ promotes injury-induced vascular neointimal hyperplasia through the E-prostanoid 3 receptor
- PMID: 23595951
- PMCID: PMC4219358
- DOI: 10.1161/CIRCRESAHA.113.301033
Cyclooxygenase-2-derived prostaglandin E₂ promotes injury-induced vascular neointimal hyperplasia through the E-prostanoid 3 receptor
Abstract
Rationale: Vascular smooth muscle cell (VSMC) migration and proliferation are the hallmarks of restenosis pathogenesis after angioplasty. Cyclooxygenase (COX)-derived prostaglandin (PG) E₂ is implicated in the vascular remodeling response to injury. However, its precise molecular role remains unknown.
Objective: This study investigates the impact of COX-2-derived PGE₂ on neointima formation after injury.
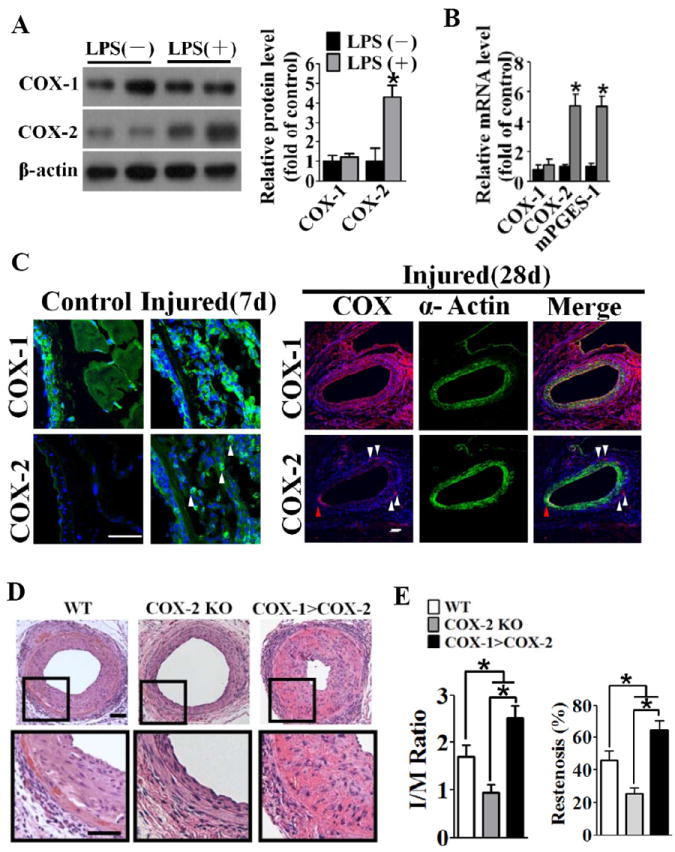
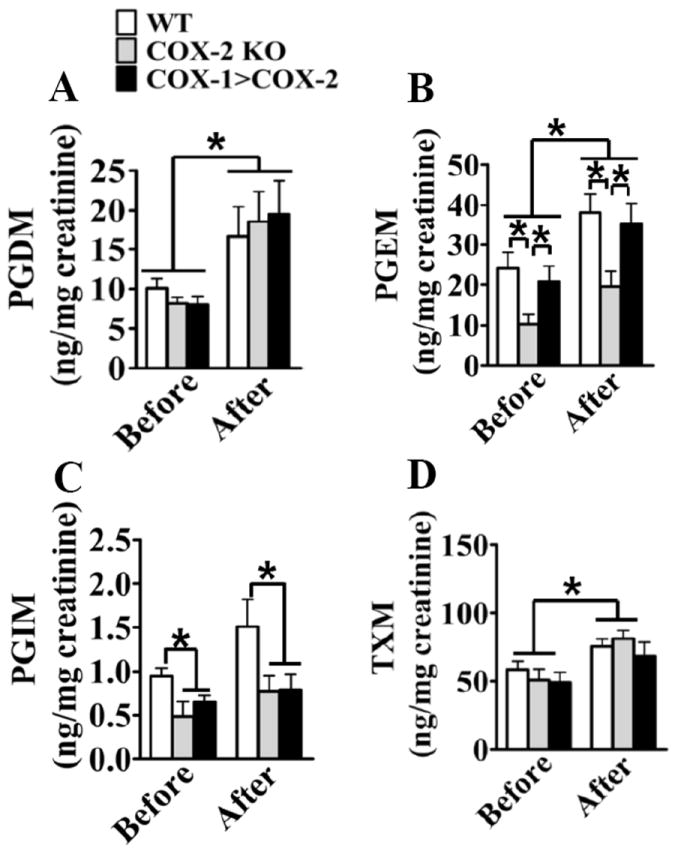
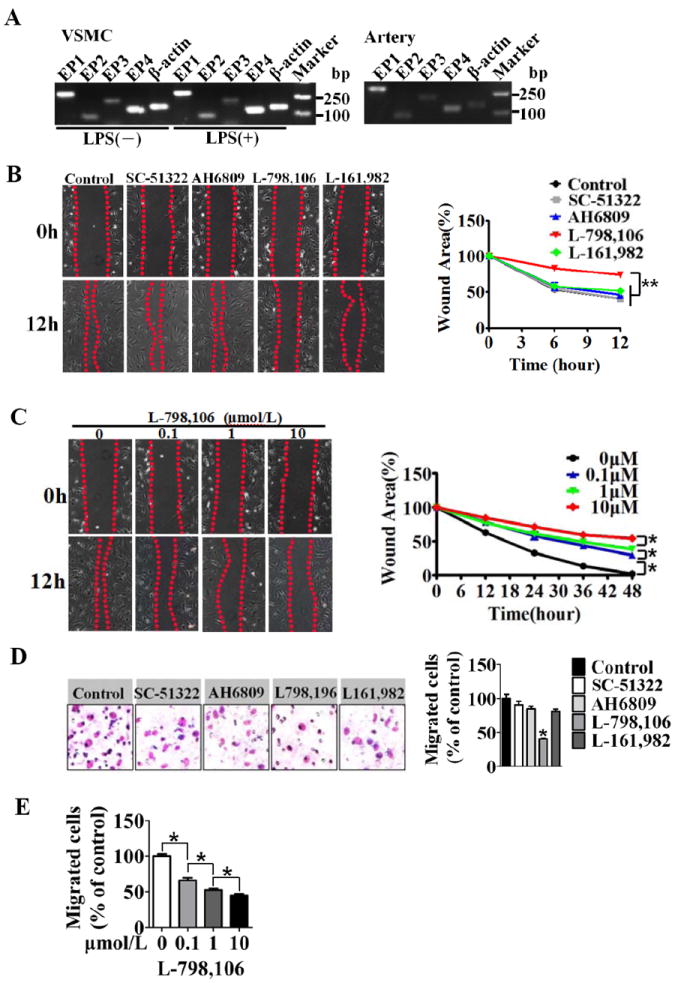
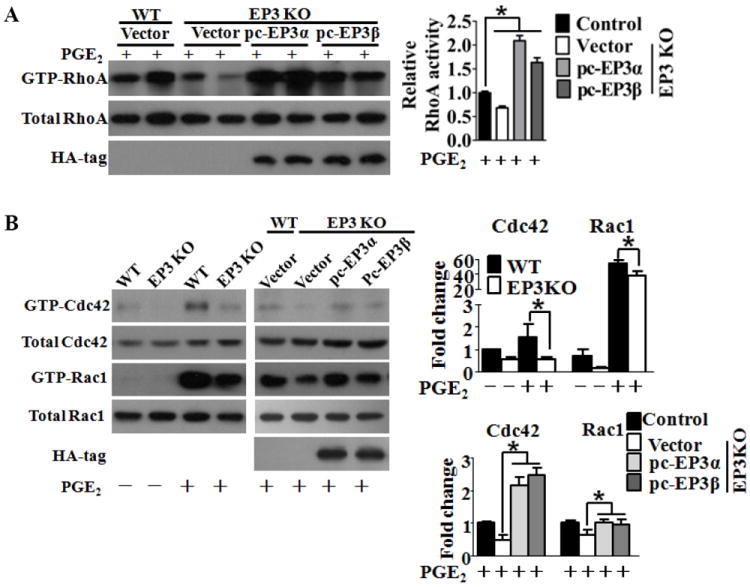
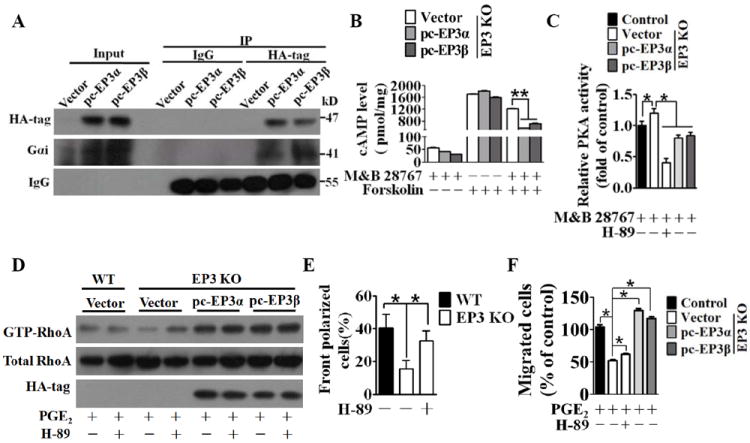
Methods and results: Vascular remodeling was induced by wire injury in femoral arteries of mice. Both neointima formation and the restenosis ratio were diminished in COX-2 knockout mice as compared with controls, whereas these parameters were enhanced in COX-1>COX-2 mice, in which COX-1 is governed by COX-2 regulatory elements. PG profile analysis revealed that the reduced PGE₂ by COX-2 deficiency, but not PGI2, could be rescued by COX-1 replacement, indicating COX-2-derived PGE₂ enhanced neointima formation. Through multiple approaches, the EP3 receptor was identified to mediate the VSMC migration response to various stimuli. Disruption of EP3 impaired VSMC polarity for directional migration by decreasing small GTPase activity and restricted vascular neointimal hyperplasia, whereas overexpression of EP3α and EP3β aggravated neointima formation. Inhibition or deletion of EP3α/β, a Gαi protein-coupled receptor, activated the cAMP/protein kinase A pathway and decreased activation of RhoA in VSMCs. PGE₂ could stimulate phosphatidylinositol 3-kinase/Akt/glycogen synthase kinase3β signaling in VSMCs through Gβγ subunits on EP3α/β activation. Ablation of EP3 suppressed phosphatidylinositol 3-kinase signaling and reduced GTPase activity in VSMCs and altered cell polarity and directional migration.
Conclusions: COX-2-derived PGE₂ facilitated the neointimal hyperplasia response to injury through EP3α/β-mediated cAMP/protein kinase A and phosphatidylinositol 3-kinase pathways, indicating EP3 inhibition may be a promising therapeutic strategy for percutaneous transluminal coronary angioplasty.
Keywords: EP3; neointima formation; polarity; prostaglandin E2; vascular smooth muscle cell migration.
Conflict of interest statement
The authors have no financial conflicts of interest.
Figures


Comment in
-
EP receptors and coxibs: seeing the light at the end of the tunnel.Circ Res. 2013 Jul 5;113(2):91-3. doi: 10.1161/CIRCRESAHA.113.301616. Circ Res. 2013. PMID: 23833287 No abstract available.
Similar articles
-
Protective Role of mPGES-1 (Microsomal Prostaglandin E Synthase-1)-Derived PGE2 (Prostaglandin E2) and the Endothelial EP4 (Prostaglandin E Receptor) in Vascular Responses to Injury.Arterioscler Thromb Vasc Biol. 2018 May;38(5):1115-1124. doi: 10.1161/ATVBAHA.118.310713. Epub 2018 Mar 29. Arterioscler Thromb Vasc Biol. 2018. PMID: 29599139 Free PMC article.
-
Targeted disruption of the prostaglandin E2 E-prostanoid 2 receptor exacerbates vascular neointimal formation in mice.Arterioscler Thromb Vasc Biol. 2011 Aug;31(8):1739-47. doi: 10.1161/ATVBAHA.111.226142. Epub 2011 Jun 2. Arterioscler Thromb Vasc Biol. 2011. PMID: 21636806
-
Spatiotemporal EP4-fibulin-1 expression is associated with vascular intimal hyperplasia.Cardiovasc Res. 2024 Dec 31;120(17):2293-2306. doi: 10.1093/cvr/cvae211. Cardiovasc Res. 2024. PMID: 39305517
-
EP receptors and coxibs: seeing the light at the end of the tunnel.Circ Res. 2013 Jul 5;113(2):91-3. doi: 10.1161/CIRCRESAHA.113.301616. Circ Res. 2013. PMID: 23833287 No abstract available.
-
Noncoding RNAs in vascular smooth muscle cell function and neointimal hyperplasia.FEBS J. 2020 Dec;287(24):5260-5283. doi: 10.1111/febs.15357. Epub 2020 May 22. FEBS J. 2020. PMID: 32367680 Review.
Cited by
-
Direct in vivo application of induced pluripotent stem cells is feasible and can be safe.Theranostics. 2019 Jan 1;9(1):290-310. doi: 10.7150/thno.28671. eCollection 2019. Theranostics. 2019. PMID: 30662568 Free PMC article.
-
MIA SH3 Domain ER Export Factor 3 Deficiency Prevents Neointimal Formation by Restoring BAT-Like PVAT and Decreasing VSMC Proliferation and Migration.Front Endocrinol (Lausanne). 2021 Nov 10;12:748216. doi: 10.3389/fendo.2021.748216. eCollection 2021. Front Endocrinol (Lausanne). 2021. PMID: 34858331 Free PMC article.
-
Inhibitory G proteins and their receptors: emerging therapeutic targets for obesity and diabetes.Exp Mol Med. 2014 Jun 20;46(6):e102. doi: 10.1038/emm.2014.40. Exp Mol Med. 2014. PMID: 24946790 Free PMC article. Review.
-
Identification and Validation of PTGS2 Gene as an Oxidative Stress-Related Biomarker for Arteriovenous Fistula Failure.Antioxidants (Basel). 2023 Dec 19;13(1):5. doi: 10.3390/antiox13010005. Antioxidants (Basel). 2023. PMID: 38275625 Free PMC article.
-
Myeloid cell microsomal prostaglandin E synthase-1 fosters atherogenesis in mice.Proc Natl Acad Sci U S A. 2014 May 6;111(18):6828-33. doi: 10.1073/pnas.1401797111. Epub 2014 Apr 21. Proc Natl Acad Sci U S A. 2014. PMID: 24753592 Free PMC article.
References
-
- Inoue T, Node K. Molecular basis of restenosis and novel issues of drug-eluting stents. Circ J. 2009;2009:615–621. - PubMed
-
- Costa MA, Simon DI. Molecular basis of restenosis and drug-eluting stents. Circulation. 2005;2005:2257–2273. - PubMed
-
- Welt FG, Rogers C. Inflammation and restenosis in the stent era. Arterioscler Thromb Vasc Biol. 2002;2002:1769–1776. - PubMed
-
- Tanaskovic S, Isenovic ER, Radak D. Inflammation as a marker for the prediction of internal carotid artery restenosis following eversion endarterectomy--evidence from clinical studies. Angiology. 2011;2011:535–542. - PubMed
-
- Horvath C, Welt FG, Nedelman M, Rao P, Rogers C. Targeting ccr2 or cd18 inhibits experimental in-stent restenosis in primates: Inhibitory potential depends on type of injury and leukocytes targeted. Circ Res. 2002;2002:488–494. - PubMed
Publication types
MeSH terms
Substances
Grants and funding
LinkOut - more resources
Full Text Sources
Other Literature Sources
Molecular Biology Databases
Research Materials
