. 2013 May 31;288(22):15725-35.
doi: 10.1074/jbc.M113.460212. Epub 2013 Apr 17.

Targeted deletion of growth hormone (GH) receptor in macrophage reveals novel osteopontin-mediated effects of GH on glucose homeostasis and insulin sensitivity in diet-induced obesity

Affiliations

Targeted deletion of growth hormone (GH) receptor in macrophage reveals novel osteopontin-mediated effects of GH on glucose homeostasis and insulin sensitivity in diet-induced obesity

Chunxia Lu et al. J Biol Chem. .

Abstract

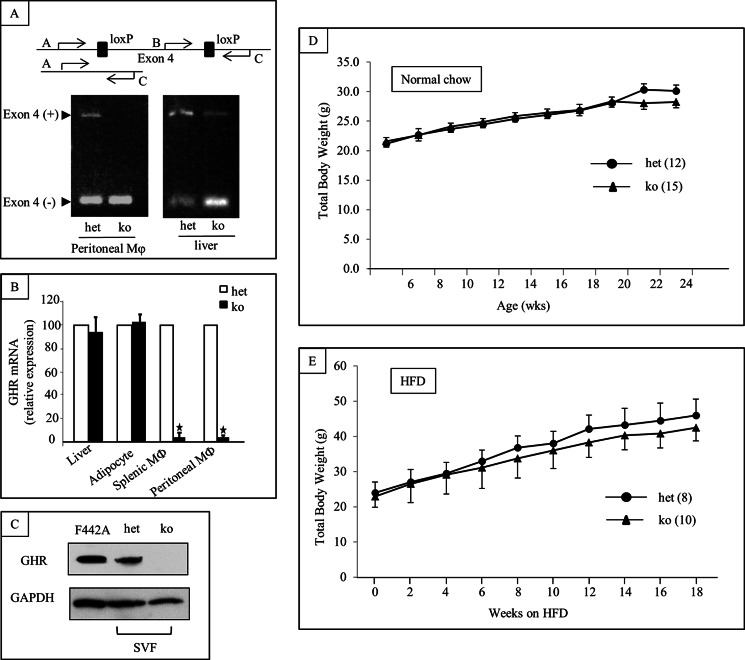
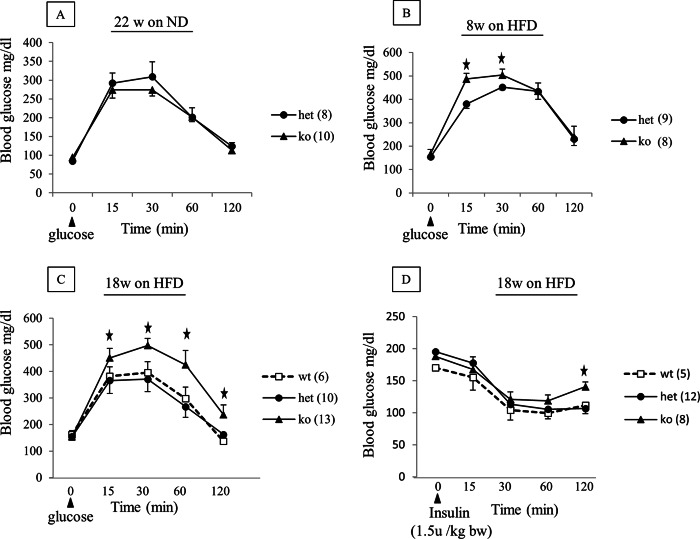
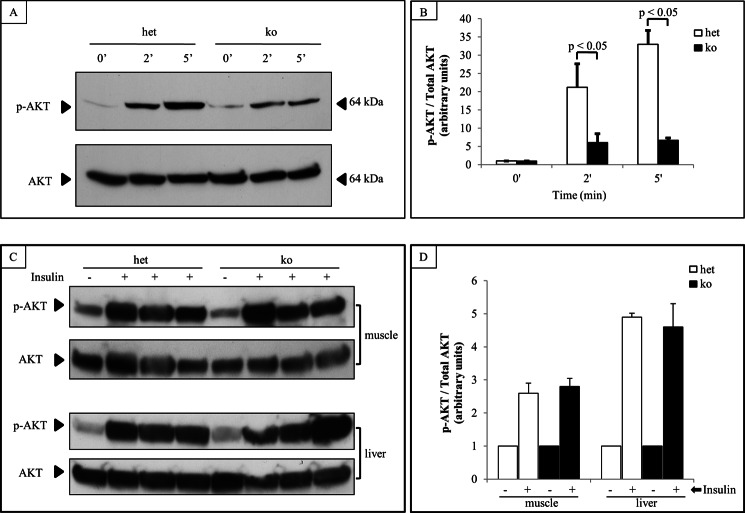
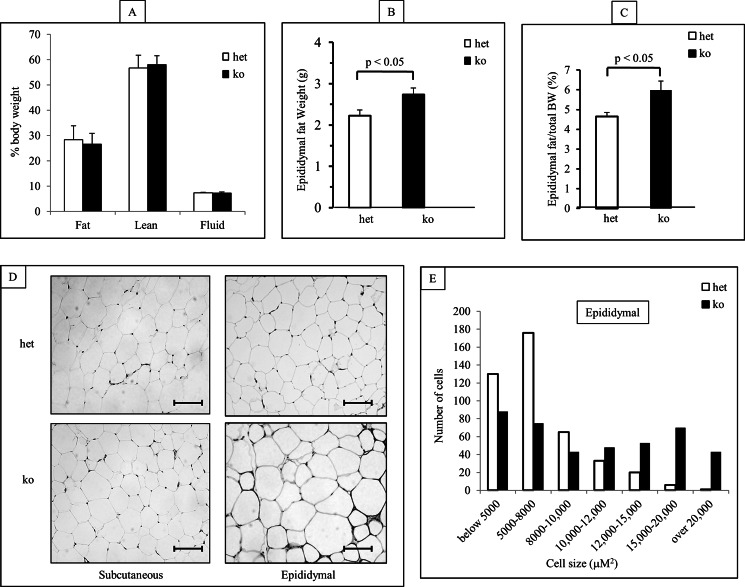
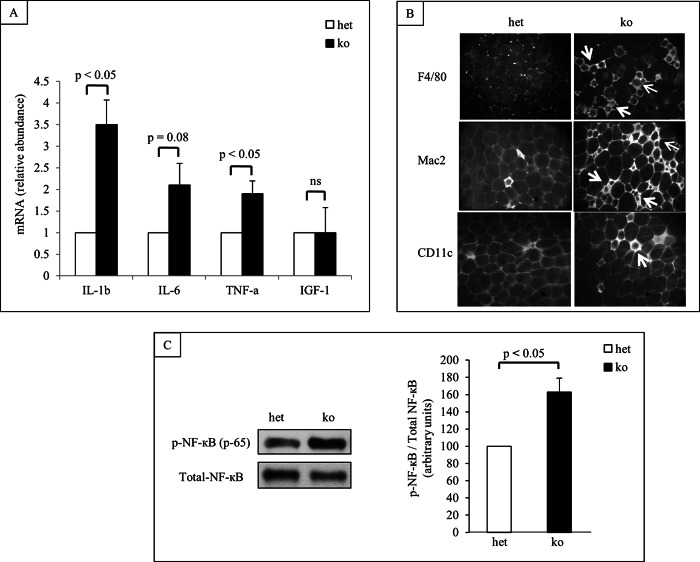
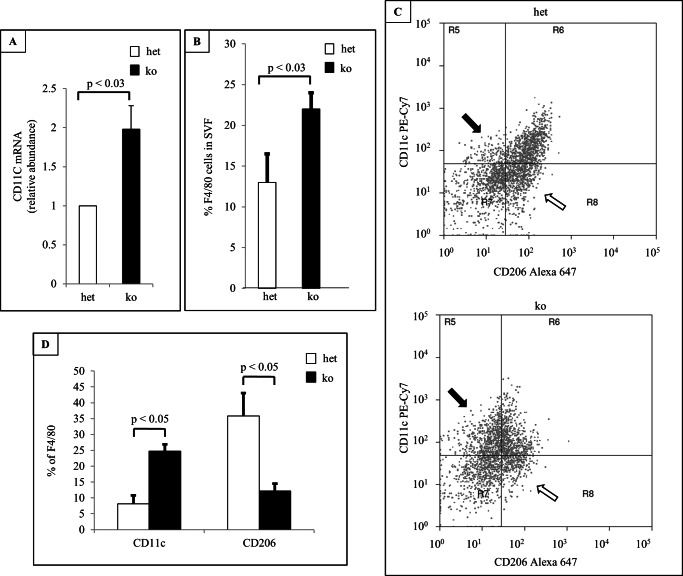
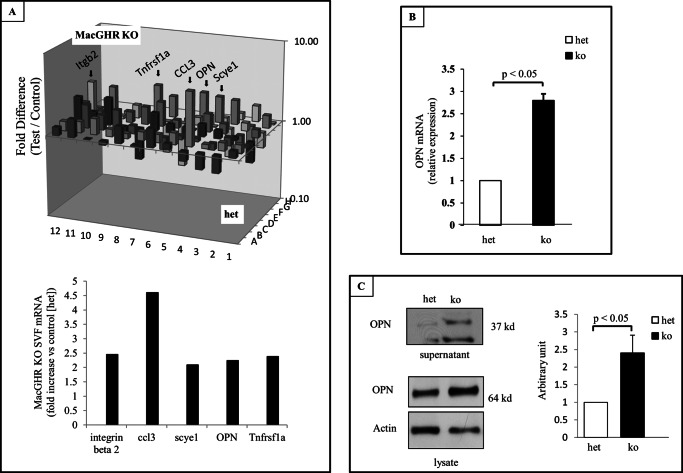
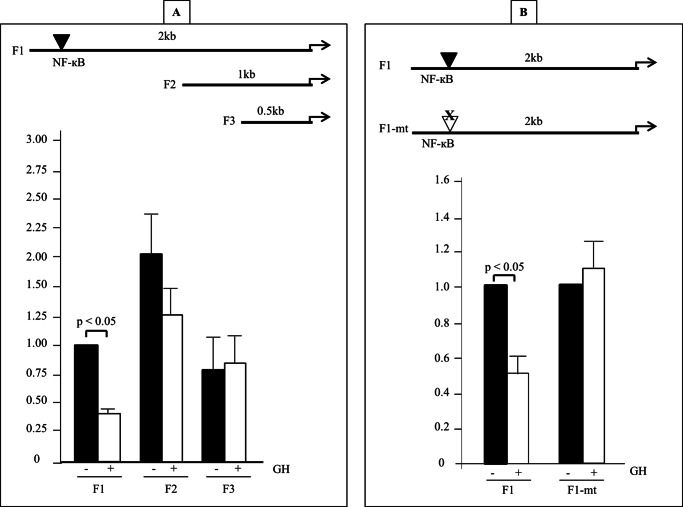
We investigated GH action on macrophage (MΦ) by creating a MΦ-specific GH receptor-null mouse model (MacGHR KO). On a normal diet (10% fat), MacGHR KO and littermate controls exhibited similar growth profiles and glucose excursions on intraperitoneal glucose (ipGTT) and insulin tolerance (ITT) tests. However, when challenged with high fat diet (HFD, 45% fat) for 18 weeks, MacGHR KO mice exhibited impaired ipGTT and ITT compared with controls. In MacGHR KO, adipose-tissue (AT) MΦ abundance was increased with skewing toward M1 polarization. Expression of pro-inflammatory cytokines (IL1β, TNF-α, IL6, and osteopontin (OPN)) were increased in MacGHR KO AT stromal vascular fraction (SVF). In MacGHR KO AT, crown-like-structures were increased with decreased insulin-dependent Akt phosphorylation. The abundance of phosphorylated NF-κB and of OPN was increased in SVF and bone-marrow-derived MΦ in MacGHR KO. GH, acting via an NF-κB site in the distal OPN promoter, inhibited the OPN promoter. Thus in diet-induced obesity (DIO), lack of GH action on the MΦ exerts an unexpected deleterious effect on glucose homeostasis by accentuating AT inflammation and NF-κB-dependent activation of OPN expression. These novel results in mice support the possibility that administration of GH could have salutary effects on DIO-associated chronic inflammation and insulin resistance in humans.

Keywords: Adipose Tissue; Growth Hormone; Inflammation; Macrophages; Obesity.


Figures

FIGURE 1.
FIGURE 1.
Targeted deletion of GH receptor in MΦ. A, genomic DNA PCR for Cre and the floxed GH receptor exon 4; absence of AC band containing exon 4 in peritoneal MΦ with retention of band in liver DNA. B, GHR mRNA expression is extinguished in MΦ (splenocytes and peritoneal) but retained in liver and adipocytes in MacGHR KO (ko, Ghr−/−, solid bar) versus het (Ghrfl/−, open bar); Internal control, GAPDH (mean ± S.E. (n = 4–5)), *, p < 0.05. C, Western blot with anti-GH receptor antibody (AL-47, 1:1000) demonstrating absence of GH receptor band in SVF MΦ from MacGHR KO. Positive control (F442A pre-adipocytes); loading control (GAPDH). D & E, weight profile of MacGHR KO (ko, Ghr−/−, ▴) and control mice (het (Ghrfl/−,●)) on normal chow (D) or high fat diet (E).
FIGURE 2.
FIGURE 2.
Progressive impairment in glucose tolerance and increased insulin resistance in MacGHR KO on HFD. MacGHR KO (ko, Ghr−/−, ▴) and control mice (wt [Ghrfl/fl,□], or het [Ghrfl/−,●]) were fasted overnight prior to ipGTT or 5 h prior to intraperitoneal ITT. Blood glucose levels were then measured using a glucometer from tail blood taken at indicated time points over a 2-h period. A, ipGTT in 22 week old male het and ko mice fed standard diet. B & C, ipGTT in male het and ko mice fed HFD (45% Kcal fat) for 8 weeks (panel B) or 18 weeks (panel C). D, ITT in male wt, het or ko mice fed a HFD (45% kcal fat) for 18 weeks. Data are mean ± S.E., *, p < 0.05 ko versus het or wt.
FIGURE 3.
FIGURE 3.
Decreased insulin-stimulated-phospho-Akt in adipose tissue of MacGHR KO. A & B, ex vivo insulin stimulation in adipose tissue isolated from het [Ghrfl/−, open bar) or MacGHR KO (Ghr−/−, solid bar) mice on HFD for 18w. Adipose tissues were incubated with insulin for 0, 2, or 5 min. Akt phosphorylation and total Akt protein were assessed by Western blot. A, representative Western blots. B, quantification of Akt phosphorylation normalized to total Akt protein. Data are mean ± S.E. of three experiments, *, p < 0.05. C & D, in vivo insulin stimulation of muscle and liver Akt activation in het [Ghrfl/−, open bar) or MacGHR KO (Ghr−/−, solid bar) mice on HFD for 18w. 10 min after intraperitoneal injection of insulin, muscle, and liver tissue was harvested for measurement of Akt phosphorylation and total Akt protein by Western blot. A, representative Western blots. B, quantification of Akt phosphorylation normalized to total Akt protein. Data are mean ± S.E. of three experiments.
FIGURE 4.
FIGURE 4.
Increased epididymal fat and adipocyte cell size in MacGHR KO mice fed HFD for 18w. A, body composition of het (Ghrfl/−, open bar) and MacGHR KO (Ghr−/−, solid bar). B & C, epididymal fat pad weight in het (Ghrfl/−, open bar) and MacGHR KO (Ghr−/−, solid bar) mice depicted as either (B) absolute weight or (C) ratio of epididymal fat weight to total body weight (mean ± S.E.; n = 10); D, hematoxylin and eosin staining of subcutaneous and epididymal adipose tissues from het (Ghrfl/−) and MacGHR KO (Ghr−/−). E, analysis of adipocyte cell size distribution in het (Ghrfl/−, open bar) and MacGHR KO (Ghr−/−, solid bar) mice. Bar represent 100 μm. For the distribution of adipocyte size at least 120 cells were analyzed per animal.
FIGURE 5.
FIGURE 5.
Increased inflammation in adipose tissue of MacGHR KO mice fed HFD for 18w. A, increased expression of inflammatory cytokines. Total RNA was isolated from SVF of het (Ghrfl/−, open bar) or MacGHR KO (Ghr−/−, solid bar) mice and expression levels of the indicated cytokines anf IGF-1 were measured by SYBR Green RT-qPCR analysis. Expression levels were normalized to housekeeping gene GAPDH. The result (n = 3–5) is presented as mean ± S.E. B, increased crown-like structure in adipose tissue of MacGHR KO. Formadehyde-fixed adipose tissues were stained with pan MΦ antibodies F4/80 or Mac2, and M1 MΦ specific antibody CD11C. Crown-like structures are indicated with arrows. C, increased phopho-NF-κB protein in MΦ from MacGHR KO mice. Left panel: representative Western blot of three independent experiments. Right panel: quantification of NF-κB phosphorylation normalized to total NF-κB protein in het (open bar, set as 100) or MacGHR KO (solid bar) mice. Data are means ± S.E. of three times experiments, *, p < 0.05.
FIGURE 6.
FIGURE 6.
Increased MΦ and M1/M2 ratio in SVF of MacGHR KO mice fed HFD for 18w. A, expression of M1 marker, CD11c, in SVF of het (Ghrfl/−, open bar) or MacGHR KO (Ghr−/−, solid bar) measure by SYBR-RT-PCR. B, percentage of F4/80-positive cells in SVF of het (Ghrfl/−, open bar) or MacGHR KO (Ghr−/−, solid bar) analyzed using flow cytometry. C, representative flow cytometry results. CD11c-positive cells are indicated by black arrows and CD206-positive cells indicated by open arrows. D, percentage of CD11c and CD206 cells of F4/80-positive cells. The results are shown as means ± S.E. for six to seven animals per group. *, p < 0.05.
FIGURE 7.
FIGURE 7.
Increased expression of OPN in MacGHR KO mice fed HFD for 18w. A, PCR array analysis of cytokine expression in SVF isolated from het (Ghrfl/−) or MacGHR KO (Ghr−/−) mice. Upper panel, three-dimensional representation of the change (positive and negative) in mRNA expression in MacGHR KO versus het. The bars representing proinflammatory genes increased in the MacGHR KO SVF are indicated by arrows. Lower panel, graphical representation of the fold increase in the proinflammatory genes, itgb2 (integrin β2), ccl3 (chemokine [C-C motif] ligand 3, also known as macrophage inflammatory protein-1α (MIP-1α),), scye 1 (small inducible cytokine subfamily E. member 1), spp1 (osteopontin), and Tnfrsaf1a (tumor necrosis factor receptor superfamily, member 1A); B, expression of OPN mRNA in SVF. Total RNA was isolated from SVF of het (Ghrfl/−, open bar) or MacGHR KO (Ghr−/−, solid bar) mice. SYBR Green RT-PCR was conducted as described under “Experimental Procedures” and results normalized to GAPDH level. The results are shown as means ± S.E. for three to five animals per group. *, p < 0.05. C, Western blot analysis of bone marrow-derived MΦ from either supernatant (upper panel) or total cell lysate (middle panel) from het (Ghrfl/−) or MacGHR KO (Ghr−/−). Bottom panel, densitometric analysis of Western blots of OPN in lysate normalized to actin.
FIGURE 8.
FIGURE 8.
GH inhibits OPN promoter activity. A, top panel, deletion analysis of OPN promoter. OPN promoters of varying length (F1, F2, and F3) were generated by PCR and inserted into the luciferase reporter vector pGL3. Bottom panel, J774A.1 cells were transfected with pGL3 basic, F1, F2, or F3 OPN-pGL3, and exposed to either vehicle (solid bar) or GH (500 ng/ml; open bar) × 24 h prior to measurement of luciferase activity. Luciferase activities (Renilla luciferase was used to normalize for transfection efficiency) are expressed as fold increase over activity in the absence of GH. Values are expressed as mean ± S.E. of five independent experiments. B, top panel, location of the NF-κB site in F1 segment that was mutated (mt). Bottom panel, J774A.1 cells were transfected with F1, or F1-mt and exposed to either vehicle (solid bar) or GH (500 ng/ml; open bar) × 48 h. Luciferase activities (Renilla luciferase was used to normalize for transfection efficiency) are expressed as fold increase over activity in the absence of GH. Values are expressed as mean ± S.E. of four independent experiments.

Similar articles

Cited by

References

    1. Newbern D., Freemark M. (2011) Placental hormones and the control of maternal metabolism and fetal growth. Curr. Opin. Endocrinol. Diabetes Obes. 18, 409–416 - PubMed
    1. Bloch C. A., Clemons P., Sperling M. A. (1987) Puberty decreases insulin sensitivity. J. Pediatr. 110, 481–487 - PubMed
    1. Clayton P. E., Cowell C. T. (2000) Safety issues in children and adolescents during growth hormone therapy–a review. Growth Horm IGF Res. 10, 306–317 - PubMed
    1. Møller N., Jørgensen J. O. (2009) Effects of growth hormone on glucose, lipid, and protein metabolism in human subjects. Endocr. Rev. 30, 152–177 - PubMed
    1. Johansen T., Laurino C., Barreca A., Malmlöf K. (2005) Reduction of adiposity with prolonged growth hormone treatment in old obese rats: effects on glucose handling and early insulin signaling. Growth Horm IGF Res. 15, 55–63 - PubMed

Publication types

MeSH terms