. 2013 Jun;143(6):938S-47S.
doi: 10.3945/jn.112.172858. Epub 2013 Apr 17.

The CDC's Second National Report on Biochemical Indicators of Diet and Nutrition in the U.S. Population is a valuable tool for researchers and policy makers

Affiliations

The CDC's Second National Report on Biochemical Indicators of Diet and Nutrition in the U.S. Population is a valuable tool for researchers and policy makers

Christine M Pfeiffer et al. J Nutr. 2013 Jun.

Abstract

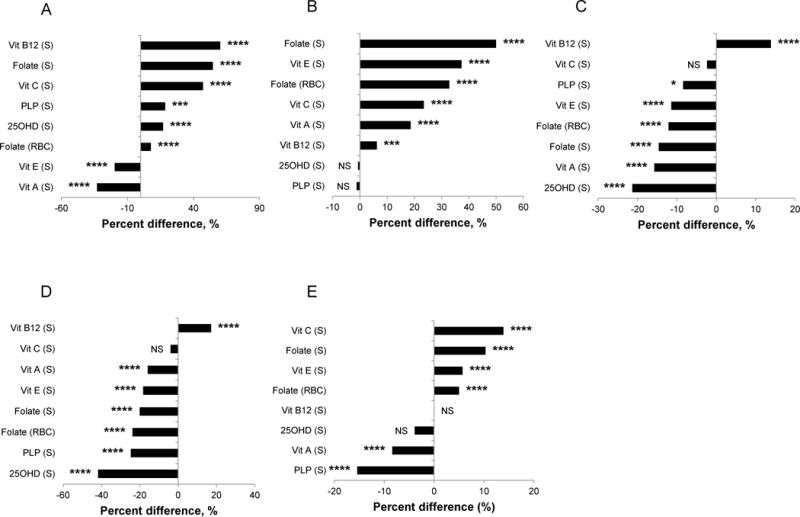
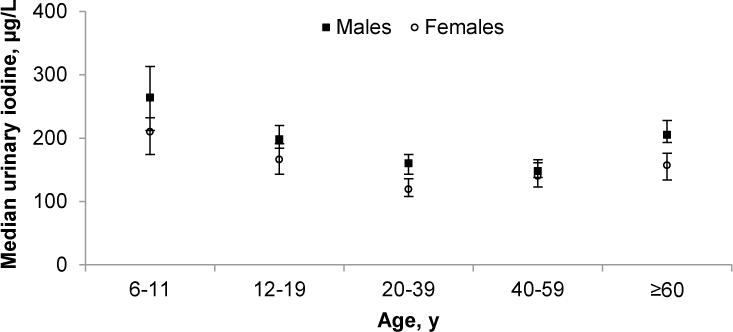
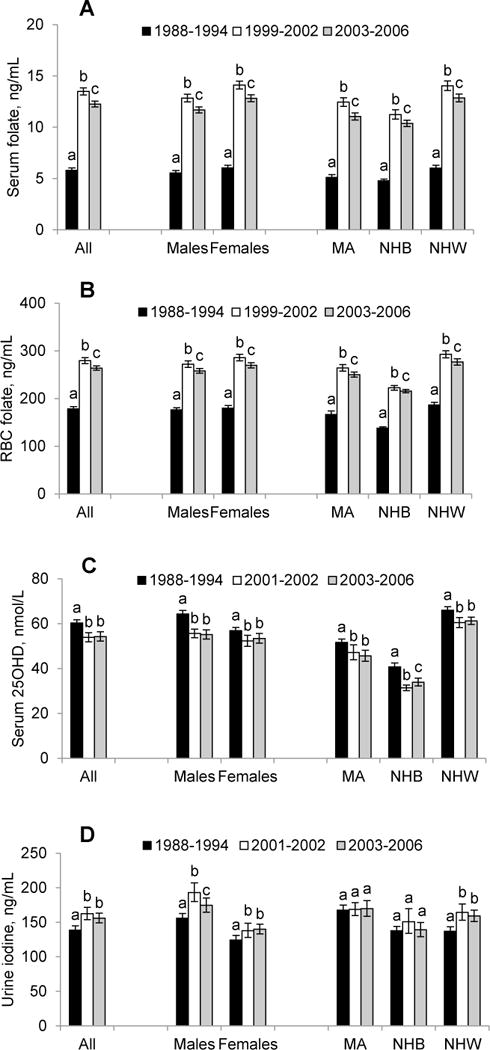
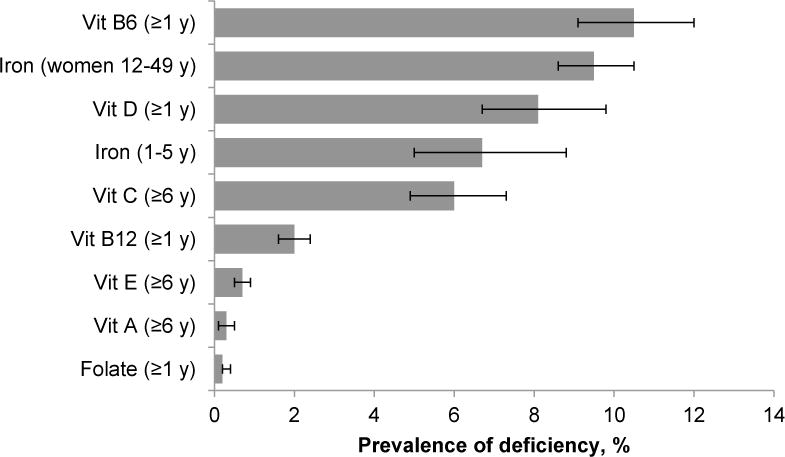
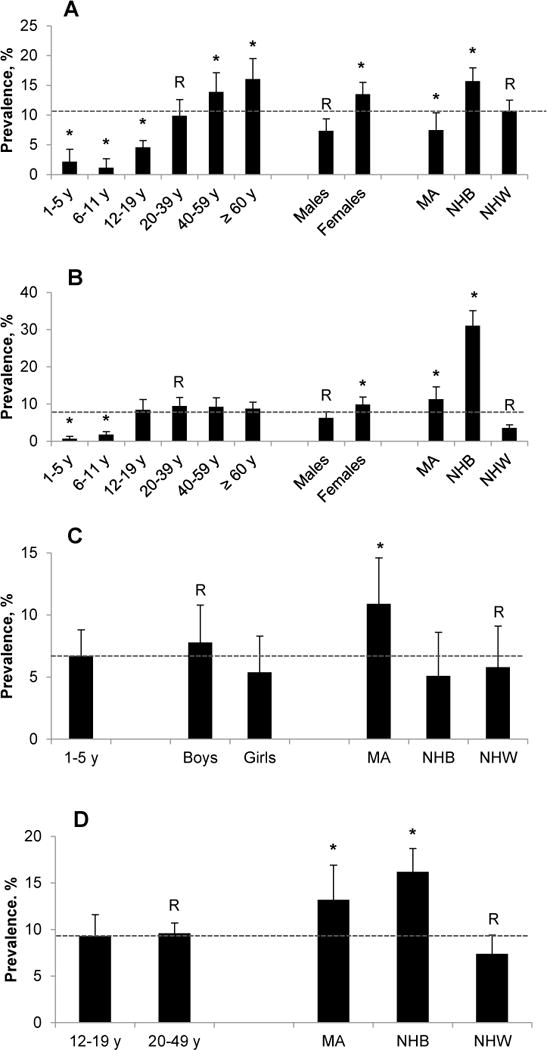
The CDC's National Report on Biochemical Indicators of Diet and Nutrition in the U.S. Population (Nutrition Report) is a serial publication that provides ongoing assessment of the population's nutritional status. The Nutrition Report presents data on blood and urine biomarker concentrations (selected water- and fat-soluble vitamins and nutrients, trace elements, dietary bioactive compounds) from a representative sample of the population participating in the NHANES. The Second Nutrition Report (released in 2012) contains reference information (means and percentiles) for 58 biomarkers measured during all or part of 2003-2006, stratified by age, sex, and race-ethnicity. Where available, we presented cutoff-based prevalence data during 2003-2006 and data on changes in biomarker concentrations or prevalence since 1999. Blood vitamin concentrations were generally higher in older (≥ 60 y) than in younger (20-39 y) adults and lower in Mexican Americans and non-Hispanic blacks than in non-Hispanic whites. Nearly 80% of Americans (aged ≥ 6 y) were not at risk of deficiencies in any of the 7 vitamins studied (vitamins A, B-6, B-12, C, D, and E and folate). Deficiency rates varied by age, sex, and race-ethnicity. Approximately 90% of women (aged 12-49 y) were not at risk of iron deficiency, but only 68% were not at risk of deficiencies in iron and all 7 vitamins. Young women (20-39 y) had median urine iodine concentrations bordering on insufficiency. First-time data are presented on plasma concentrations of 24 saturated and mono- and polyunsaturated fatty acids. Tabulation and graphical presentation of NHANES data in the Second Nutrition Report benefits those organizations involved in developing and evaluating nutrition policy.


Conflict of interest statement

Author disclosures: C.M. Pfeiffer, M.R. Sternberg, R.L. Schleicher, B.M.H. Haynes, M.E. Rybak, J.L. Pirkle, no conflicts of interest.

Figures

Figure 1
Figure 1
Relative differences in geometric mean concentrations (arithmetic mean for serum vitamin C) comparing two demographic subgroups in the US population aged ≥6 y, NHANES 2003–2006. Panel A: children (6–11 y) vs. young adults (20–39 y); panel B: older (≥60 y) vs. young (20–39 y) adults; panel C: MA vs. NHW; panel D: NHB vs. NHW; panel E: females vs. males. Vitamin B-6, A, and E data are only available for NHANES 2005–2006. The relative difference was obtained by calculating the difference between the geometric (arithmetic) mean concentration of the comparison group (mentioned first) and the reference group (mentioned second) divided by the geometric (arithmetic) mean concentration of the reference group, and expressed in percent. The level of significant difference is indicated as follows: * <0.05; ** <0.01; *** <0.001; **** <0.0001; NS, not significant, P <0.05. Refer to Supplemental Table 2 for sample sizes (n). 25OHD, 25-hydroxyvitamin D; MA, Mexican Americans; NHB, non-Hispanic blacks; NHW, non-Hispanic whites; PLP, pyridoxal-5′-phosphate; vit, vitamin.
Figure 2
Figure 2
Median concentrations of urine iodine in the US population aged ≥6 y by age group and sex, NHANES 2001–2006. Median urine iodine concentrations (μg/L) <100, 100–199, 200–299, and ≥300 represent insufficient, adequate, above requirements, and excessive intake, respectively. Error bars represent 95% CI. Sample sizes (n) were as follows: males: 307 [6–11 y], 693 [12–19 y], 512 [20–39 y], 454 [40–59 y], 511 [≥60 y]; females: 359 [6–11 y], 750 [12–19 y], 622 [20–39 y], 465 [40–59 y], 502 [≥60 y]. The SI conversion factor (nmol/L) for urine iodine is ×7.88.
Figure 3
Figure 3
Time trends of age-adjusted geometric mean concentrations of serum folate (panel A, persons ≥4 y) and RBC folate (panel B, persons ≥4 y), serum 25-hydroxyvitamin D (panel C, persons ≥12 y), and urine iodine (panel D, persons ≥6 y) by sex and race-ethnicity in the US population, NHANES 1988–2006. Error bars represent 95% CI. Within a demographic group, bars not sharing a common letter differ (P <0.05). Age adjustment was done using direct standardization. Refer to Supplemental Table 3 for sample sizes (n). MA, Mexican American; NHB, non-Hispanic black; NHW, non-Hispanic white. SI conversion factors are as follows: folate, ×2.266 (nmol/L); iodine, ×7.88 (nmol/L).
Figure 4
Figure 4
Prevalence estimates for risk of nutrient deficiencies in the US population, NHANES 2003–2006. Error bars represent 95% CI. Nutritional biomarkers were measured in different age (e.g., ≥1 y, ≥6 y) and population groups (e.g., women 12–49 y, children 1–5 y). Cutoff values (sample size) used to estimate prevalence are: vitamin B-6 (serum pyridoxal-5′-phosphate <20 nmol/L, [n = 8311]), iron (serum body iron <0 mg/kg, [n = 1369 children and 4476 women]), vitamin D (serum 25-hydroxyvitamin D <30 nmol/L, [n = 16604]), vitamin C (serum ascorbic acid <11.4 μmol/L, [n = 14579]), vitamin B-12 (serum total cobalamin <200 ng/L [148 pmol/L], [n = 16316]), vitamin A (serum retinol <0.70 μmol/L, [n = 7254]), vitamin E (serum α-tocopherol <11.6 µmol/L, [n = 7254]), and folate (RBC folate <95 μg/L [215 nmol/L], [n = 16670]). Vitamin B-6, A and E data are only available for NHANES 2005–2006.
Figure 5
Figure 5
Prevalence estimates for risk of nutrient deficiencies by age, sex, and race-ethnicity in the US population, NHANES 2003–2006. Panel A: vitamin B-6 deficiency in persons ≥1 y (serum pyridoxal-5′-phosphate <20 nmol/L); panel B: vitamin D deficiency in persons ≥1 y (serum 25-hydroxyvitamin D <30 nmol/L); panel C: iron deficiency in children 1–5 y (serum body iron <0 mg/kg); panel D: iron deficiency in women 12–49 y (serum body iron <0 mg/kg). Error bars represent 95% CI. Within a demographic group, bars labeled with an asterisk indicate a significant difference (P <0.05) relative to the reference group R. Dotted horizontal lines represent the overall prevalence for the population captured in each panel. Vitamin B-6 data are only available for NHANES 2005–2006. Refer to Supplemental Table 4 for sample sizes (n). MA, Mexican American; NHB, non-Hispanic black; NHW, non-Hispanic white.

References

    1. Yetley E, Johnson C. Nutritional applications of the Health and Nutrition Examination Survey (HANES) Annu Rev Nutr. 1987;7:441–63. - PubMed
    1. Wright JD, Borrud LG, McDowell MA, Wang C-Y, Radimer K, Johnson CL. Nutrition assessment in the National Health and Nutrition Examination Survey 1999-2002. J Am Diet Assoc. 2007;107:822–9. - PubMed
    1. U.S. Centers for Disease Control and Prevention. About the National Health and Nutrition Examination Survey. [cited 2012 Aug 24]. Available from: http://www.cdc.gov/nchs/nhanes.htm.
    1. U.S. Centers for Disease Control and Prevention. Second National Report on Biochemical Indicators of Diet and Nutrition in the US Population 2012. Atlanta, GA: National Center for Environmental Health; Apr, 2012. [cited 2013 Feb 4]. Available from: http://www.cdc.gov/nutritionreport.
    1. U.S. Centers for Disease Control and Prevention. National Report on Biochemical Indicators of Diet and Nutrition in the US Population 1999–2002. Atlanta, GA: National Center for Environmental Health; Jul, 2008. [cited 2013 Feb 01]. Available from: http://www.cdc.gov/nutritionreport.