

Results of external quality assessment for proviral DNA testing of HIV tropism in the Maraviroc Switch collaborative study
- PMID: 23596247
- PMCID: PMC3697703
- DOI: 10.1128/JCM.00510-13
Results of external quality assessment for proviral DNA testing of HIV tropism in the Maraviroc Switch collaborative study
Abstract
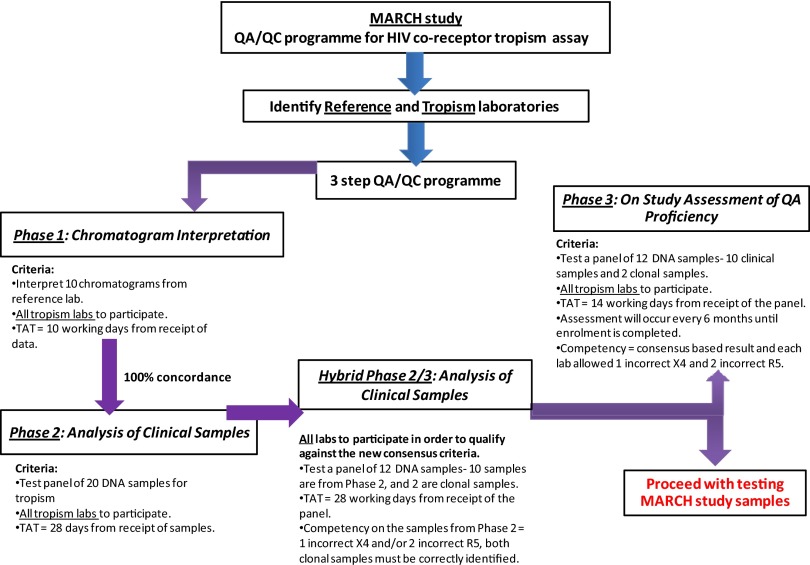
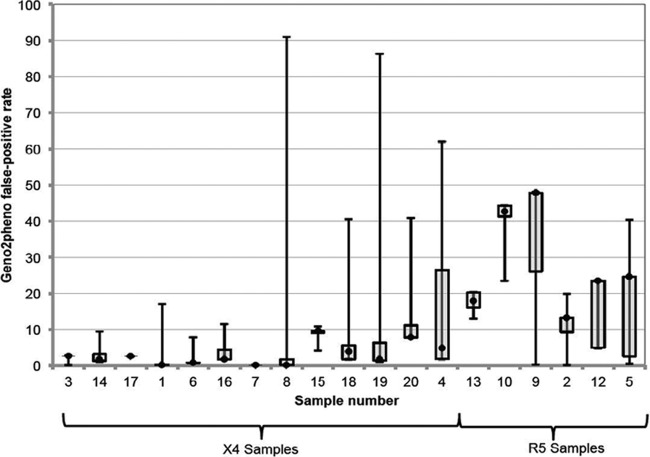
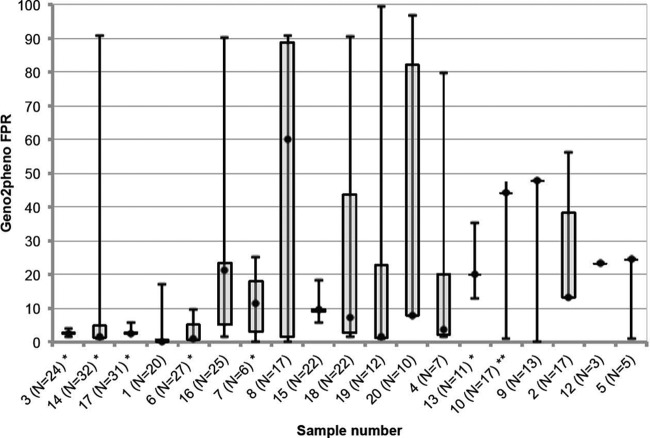
The Maraviroc Switch collaborative study (MARCH) is a study in aviremic patients on stable antiretroviral therapy and utilizes population-based sequencing of proviral DNA to determine HIV tropism and susceptibility to maraviroc. An external quality assessment (EQA) program was implemented to ensure competency in assessing the tropism of clinical samples conducted by MARCH laboratories (n = 14). The MARCH EQA has three prestudy phases assessing V3 loop sequencing and tropism determination using the bioinformatic algorithm geno2pheno, which generates a false-positive rate (FPR). DNA sequences with low FPRs are more likely to be from CXCR4-using (X4) viruses. Phase 1 of the EQA involved chromatogram interpretation. Phases 2, 2/3, and 3 involved patient and clonal samples. Clinical samples used in these phases were from treatment-experienced HIV-infected volunteers; 18/20 had viral loads of <50 copies/ml, and 10/15 were CXCR4-tropic on prior phenotyping. All samples were tested in triplicate, and any replicate with a geno2pheno FPR of <10% was designated X4. Performance was deemed adequate if ≤2 R5 and ≤1 X4 specimens were miscalled. For several clinical samples in the EQA, triplicate testing revealed marked DNA variability (FPR range, 0 to 96.7%). Therefore, a consensus-based approach was employed for each sample, i.e., a median FPR across laboratories was used to define sample tropism. Further sequencing analysis showed mixed viral populations in the clinical samples, explaining the differences in tropism predictions. All laboratories passed the EQA after achieving predefined competence thresholds in either of the phase 2 rounds. The use of clinical samples from patients resembling those who were likely to be screened in the MARCH, coupled with triplicate testing, revealed inherent DNA variability that might have been missed if single or duplicate testing and/or clonal samples alone were used. These data highlight the importance of intensive EQA of tropism laboratories before embarking on clinical studies. (This study has been registered at ClinicalTrials.gov under registration no. NCT01384682 [http://www.clinicaltrials.gov/ct2/show/study/NCT01384682?term=NCT01384682&rank=1].).
Figures
Comment in
-
Issues on results of the external quality assessment for proviral DNA testing of HIV-1 tropism in the Maraviroc Switch collaborative study.J Clin Microbiol. 2013 Dec;51(12):4285-6. doi: 10.1128/JCM.02124-13. J Clin Microbiol. 2013. PMID: 24243994 Free PMC article. No abstract available.
-
Reply to "Issues on results of the external quality assessment for proviral DNA testing of HIV-1 Tropism in the Maraviroc Switch collaborative study".J Clin Microbiol. 2013 Dec;51(12):4287. doi: 10.1128/JCM.02207-13. J Clin Microbiol. 2013. PMID: 24243995 Free PMC article. No abstract available.
References
-
- Gulick RM, Lalezari J, Goodrich J, Clumeck N, DeJesus E, Horban A, Nadler J, Clotet B, Karlsson A, Wohlfeiler M, Montana JB, McHale M, Sullivan J, Ridgway C, Felstead S, Dunne MW, van der Ryst E, Mayer H, MOTIVATE Study Teams 2008. Maraviroc for previously treated patients with R5 HIV-1 infection. N. Engl. J. Med. 359:1429–1441 - PMC - PubMed
-
- Cooper DA, Heera J, Goodrich J, Tawadrous M, Saag M, Dejesus E, Clumeck N, Walmsley S, Ting N, Coakley E, Reeves JD, Reyes-Teran G, Westby M, Van Der Ryst E, Ive P, Mohapi L, Mingrone H, Horban A, Hackman F, Sullivan J, Mayer H. 2010. Maraviroc versus efavirenz, both in combination with zidovudine-lamivudine, for the treatment of antiretroviral-naive subjects with CCR5-tropic HIV-1 infection. J. Infect. Dis. 201:803–813 - PubMed
-
- Lengauer T, Sander O, Sierra S, Thielen A, Kaiser R. 2007. Bioinformatics prediction of HIV coreceptor usage. Nat. Biotechnol. 25:1407–1410 - PubMed
Publication types
MeSH terms
Substances
Associated data
LinkOut - more resources
Full Text Sources
Other Literature Sources
Medical
