. 2013 Jun;87(12):7127-39.
doi: 10.1128/JVI.03147-12. Epub 2013 Apr 17.

Potential of herpesvirus saimiri-based vectors to reprogram a somatic Ewing's sarcoma family tumor cell line

Affiliations

Potential of herpesvirus saimiri-based vectors to reprogram a somatic Ewing's sarcoma family tumor cell line

Hannah F Brown et al. J Virol. 2013 Jun.

Abstract

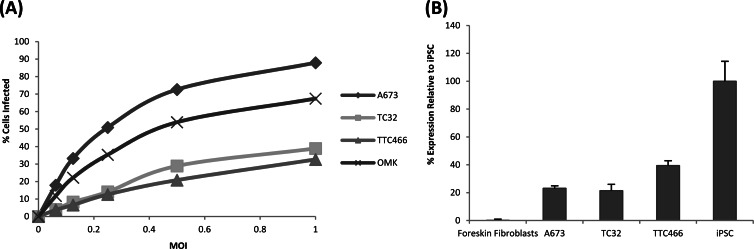
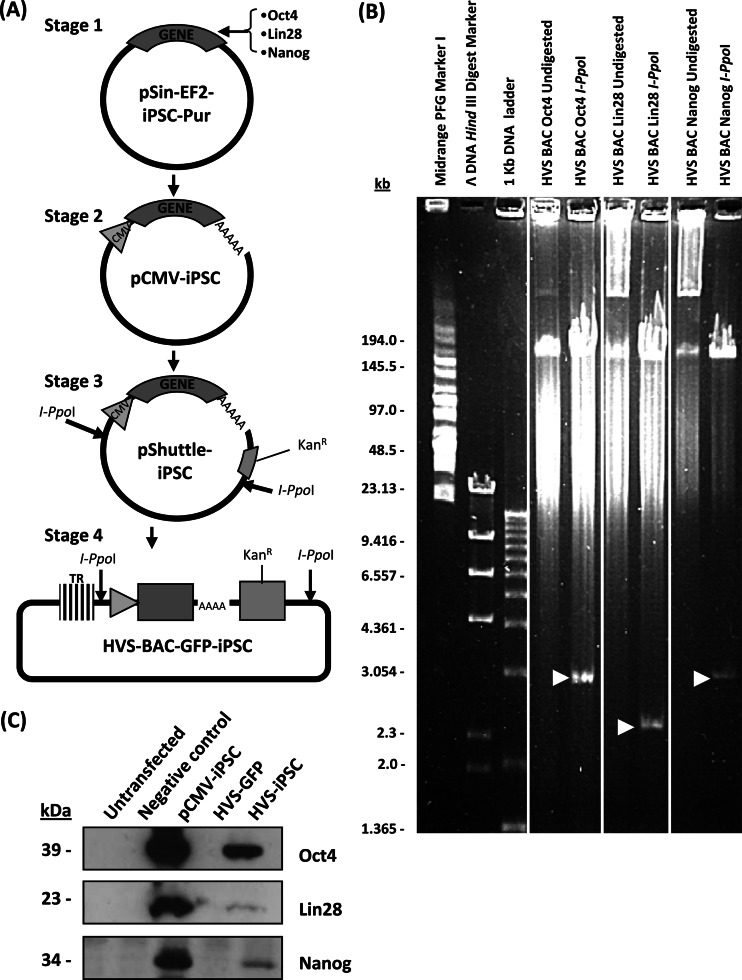
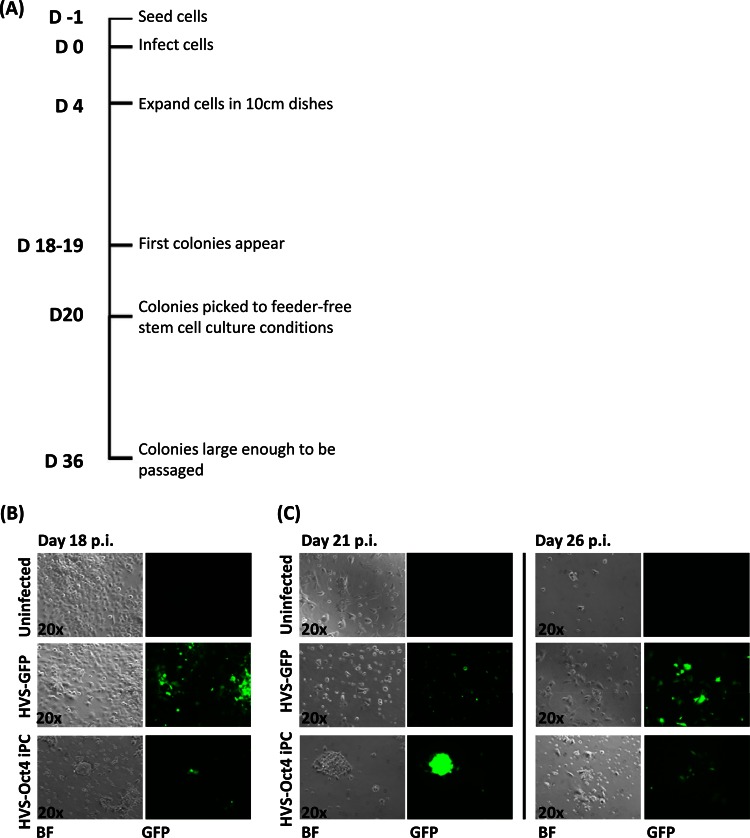
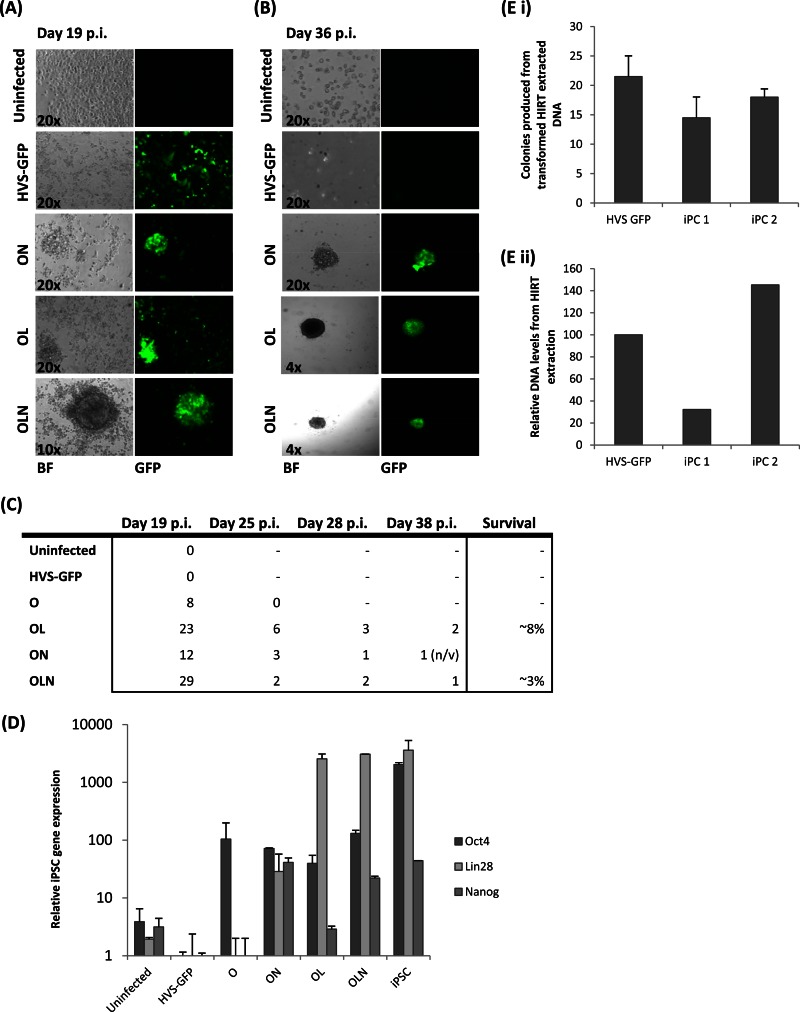
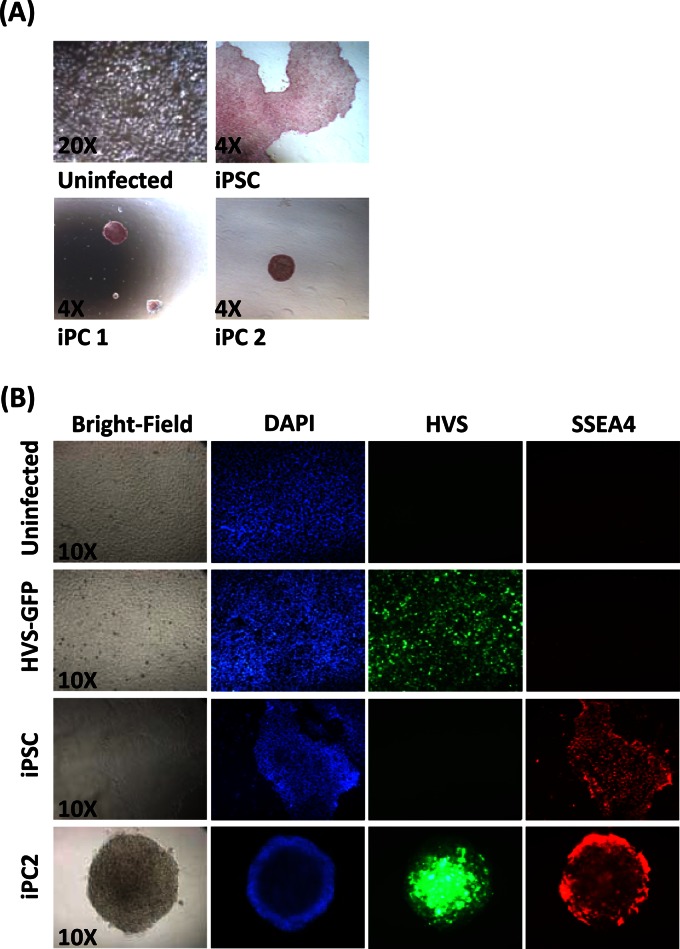
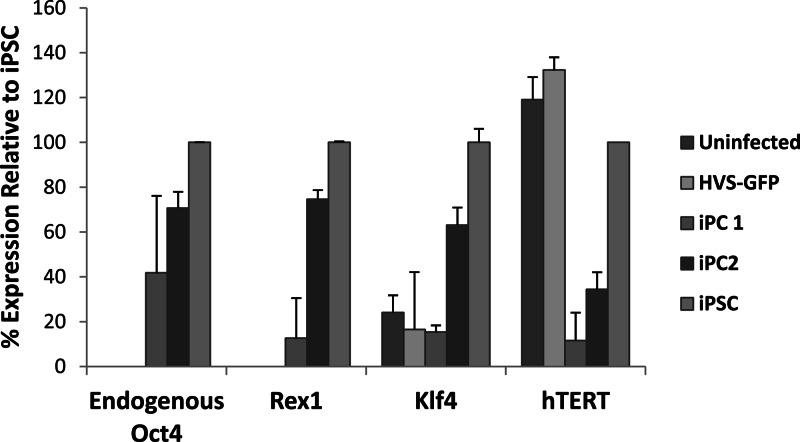
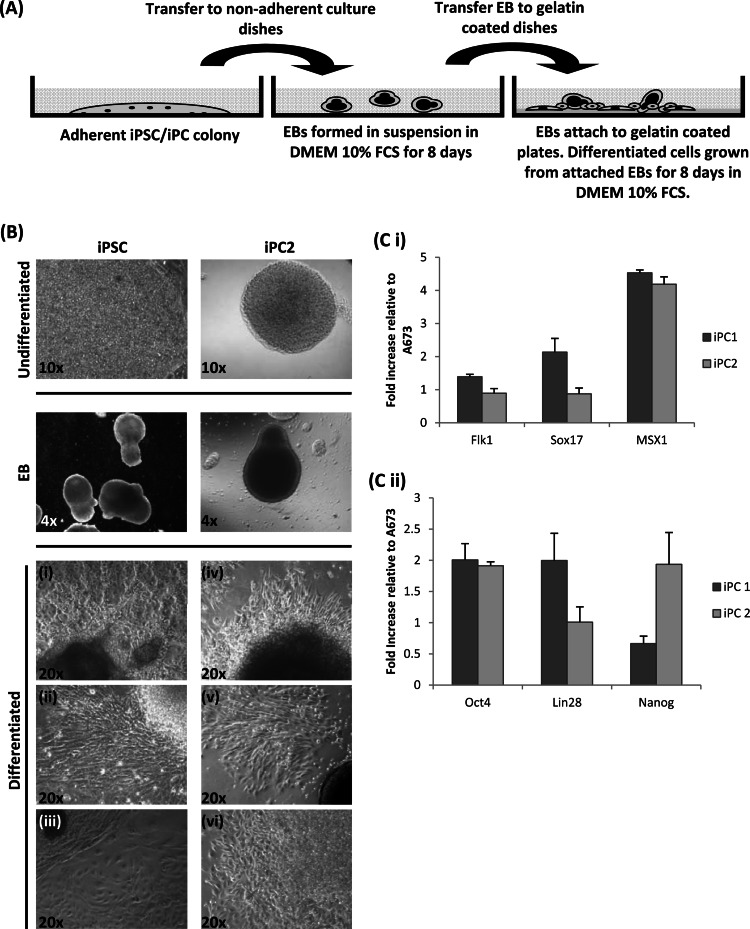
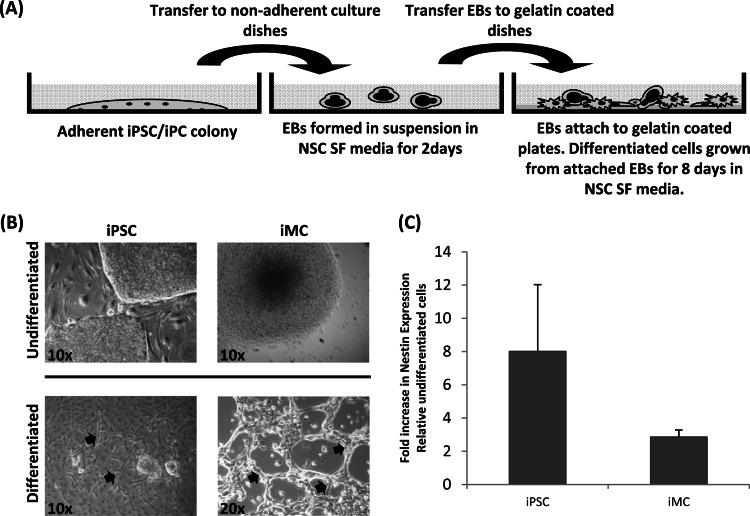
Herpesvirus saimiri (HVS) infects a range of human cell types with high efficiency. Upon infection, the viral genome can persist as high-copy-number, circular, nonintegrated episomes that segregate to progeny cells upon division. This allows HVS-based vectors to stably transduce a dividing cell population and provide sustained transgene expression in vitro and in vivo. Moreover, the HVS episome is able to persist and provide prolonged transgene expression during in vitro differentiation of mouse and human hemopoietic progenitor cells. Together, these properties are advantageous for induced pluripotent stem cell (iPSC) technology, whereby stem cell-like cells are generated from adult somatic cells by exogenous expression of specific reprogramming factors. Here we assess the potential of HVS-based vectors for the generation of induced pluripotent cancer stem-like cells (iPCs). We demonstrate that HVS-based exogenous delivery of Oct4, Nanog, and Lin28 can reprogram the Ewing's sarcoma family tumor cell line A673 to produce stem cell-like colonies that can grow under feeder-free stem cell culture conditions. Further analysis of the HVS-derived putative iPCs showed some degree of reprogramming into a stem cell-like state. Specifically, the putative iPCs had a number of embryonic stem cell characteristics, staining positive for alkaline phosphatase and SSEA4, in addition to expressing elevated levels of pluripotent marker genes involved in proliferation and self-renewal. However, differentiation trials suggest that although the HVS-derived putative iPCs are capable of differentiation toward the ectodermal lineage, they do not exhibit pluripotency. Therefore, they are hereby termed induced multipotent cancer cells.


Figures

Fig 1
Fig 1
Characterization of ESFT cell lines. (A) Flow cytometric analysis of HVS-GFP infection rates in ESFT cell lines at various MOIs at 24 h p.i. Infectivity is expressed as the percentage of the total number of counted cells that were GFP positive. (B) qRT-PCR analysis of endogenous Sox2 expression in ESFT cell lines. Expression is displayed as a percentage of the iPSC Sox2 mRNA level, which was taken to be 100%.
Fig 2
Fig 2
Generation and characterization of HVS-iPSC-BAC recombinant viruses. (A) Schematic representation of the cloning procedure. iPSC genes were PCR amplified, and the resulting products were cloned into pEGFP-c1, replacing the EGFP coding region, to produce pCMV-iPSC constructs, thereby placing iPSC genes under the control of the CMV IE promoter. CMV-iPSC expression cassettes were PCR amplified and cloned into the pShuttle Link 1 vector prior to subcloning into predigested HVS-GFP-BAC at flanking I-PpoI restriction sites. (B) PFGE of HVS-iPSC-BAC recombinants. The presence of the iPSC expression cassettes was confirmed by I-PpoI restriction digestion (white arrows). (C) 293T cells were either transfected with pCMV-iPSC constructs or infected with each HVS-iPSC viral vector expressing Oct4, Lin28, or Nanog at an MOI of 1. After 24 h, the cell lysates were immunoblotted with Oct4-, Lin28-, and Nanog-specific antibodies. Negative controls included pEGFP-c1-transfected cells and HVS-GFP-infected cells. Expression of iPSC transgenes is confirmed by the presence of specific bands at 39, 23, and 34 kDa for Oct4, Lin28, and Nanog, respectively.
Fig 3
Fig 3
A673 iPC reprogramming attempts by HVS-Oct4 transduction. (A) Schematic representation of the methodology used to generate iPCs. (B) iPC colonies appear at 18 days p.i. in A673 cells transduced with HVS-Oct4 at an MOI of 0.5 but are absent from mock- and HVS-GFP-infected control cells. The presence of the HVS-Oct4 episome within these cells is demonstrated by GFP expression. (C) iPCs were picked at day 20 p.i. and cultured under feeder-free stem cell culture conditions. Colonies were still viable under these culture conditions 1 day after picking but were incapable of surviving prolonged culture. Examples showing that the colonies had deformed at day 26 p.i. are included. Bright-field (BF) and fluorescence microscopy (GFP) images are shown.
Fig 4
Fig 4
Generation of A673 iPCs by combined infection of HVS-iPSC vectors. To improve reprogramming efficiency, the following combinations of HVS-iPSC vectors were used to infect A673 cells: ON, HVS-Oct4 and HVS-Nanog; OL, HVS-Oct4 and HVS-Lin28; OLN, HVS-Oct4, HVS-Lin28, and HVS-Nanog. Each virus was used at an MOI of 0.5. (A) iPC colonies formed at day 19 p.i. in cells infected with combinations of the HVS-iPSC vectors but were absent from mock- and HVS-GFP-infected controls. The presence of HVS-iPSC episomes within the iPCs was demonstrated by GFP expression. Bright-field (BF) and fluorescence microscopy (GFP) images are shown. (B) At day 36 p.i., surviving colonies were capable of expansion and prolonged growth under feeder-free stem cell culture conditions. Altered magnifications were used as colonies expanded. (C) Table depicting colony survival rates upon the addition of different virus infection combinations. (D) qRT-PCR to indicate the amounts of total iPSC gene expression in cells infected with the different combinations of HVS-based vectors at day 21 p.i. (E) HVS episomal DNA was isolated from control HVS-GFP-infected A673 cells and iPC colonies 1 and 2. Episomal DNA was quantified by transformation and selection on chloramphenicol plates (i) and qPCR (ii).
Fig 5
Fig 5
Characterization of putative A673 iPC colonies. (A) A673 iPC colonies stain positive for alkaline phosphatase activity (both iPC colonies 1 and 2, which were derived from OL infections). Uninfected A673 cells and iPSCs served as negative and positive controls, respectively. (B) A673 iPC colonies express the cell surface marker SSEA4 (red). Hoechst 33342 was used as a nuclear stain (blue), and the presence of HVS episomes is demonstrated by GFP. Uninfected or HVS-GFP-infected A673 cells and iPSCs served as negative and positive controls, respectively.
Fig 6
Fig 6
qRT-PCR analysis of endogenous ESC marker gene expression in A673 iPCs. Oct4, Rex1, Klf4, and hTERT mRNA levels were assessed in uninfected and HVS-GFP-infected A673 cells, A673 iPC colonies 1 and 2, and iPSCs. The expression of each respective gene is shown as a percentage of the mRNA level in the iPSCs, which represents 100%. To ensure no amplification of viral transgene Oct4 mRNA, primers were designed within the 5′ UTR of Oct4.
Fig 7
Fig 7
Nonspecific differentiation assay. (A) Schematic representation of the nonspecific differentiation methodology used. (B) A673 iPCs (iPC colony 2 was derived from an OL infection) and iPSC positive-control cells were differentiated by the initial formation of EBs in DMEM–10% FCS. EBs were subsequently grown on gelatin coated plates, and differentiated cells were allowed to grow from the attached EBs. Examples of the morphologies observed are shown in differentiated cells from iPSCs (i to iii) and A673 iPCs (iv to vi). (C i) qRT-PCR analysis for mesoderm (Flk1), endoderm (Sox17), and ectoderm (MSX1) marker gene expression. Fold increases in mRNA levels of A673 cells and two independent differentiated putative A673 iPC colonies are compared. (C ii) qRT-PCR analysis of iPSC gene expression in EBs compared to that in A673 cells.
Fig 8
Fig 8
Neuronal differentiation assay. (A) Schematic representation of the neuronal differentiation methodology used. (B) A673 iPCs and iPSC positive-control cells were differentiated by the initial formation of EBs in NSC SF medium. EBs were subsequently grown on gelatin-coated plates, and differentiated cells were allowed to grow from the attached EBs. (B) Differentiated cells in iPSCs and A673 iPCs form neural networks (arrows). (C) Levels of mRNA for Nestin, a marker of neuroprogenitor cells, were analyzed in differentiated cells. Fold increases in mRNA levels in iPSCs (left) and A673 cells (right) over those in terminally differentiated cells are shown.

Similar articles

Cited by

References

    1. Takahashi K, Yamanaka S. 2006. Induction of pluripotent stem cells from mouse embryonic and adult fibroblast cultures by defined factors. Cell 126:663–676 - PubMed
    1. Grskovic M, Javaherian A, Strulovici B, Daley GQ. 2011. Induced pluripotent stem cells—opportunities for disease modelling and drug discovery. Nat. Rev. Drug Discov. 10:915–929 - PubMed
    1. Yu J, Vodyanik MA, Smuga-Otto K, Antosiewicz-Bourget J, Frane JL, Tian S, Nie J, Jonsdottir GA, Ruotti V, Stewart R, Slukvin II, Thomson JA. 2007. Induced pluripotent stem cell lines derived from human somatic cells. Science 318:1917–1920 - PubMed
    1. Kim JB, Greber B, Arauzo-Bravo MJ, Meyer J, Park KI, Zaehres H, Scholer HR. 2009. Direct reprogramming of human neural stem cells by OCT4. Nature 461:649–653 - PubMed
    1. Sun C, Liu YK. 2011. Induced pluripotent cancer cells: progress and application. J. Cancer Res. Clin. Oncol. 137:1–8 - PMC - PubMed

Publication types

MeSH terms

Substances