. 2013 Jul;110(1):177-89.
doi: 10.1152/jn.00092.2013. Epub 2013 Apr 17.

Cortical speech-evoked response patterns in multiple auditory fields are correlated with behavioral discrimination ability

Affiliations

Cortical speech-evoked response patterns in multiple auditory fields are correlated with behavioral discrimination ability

T M Centanni et al. J Neurophysiol. 2013 Jul.

Abstract

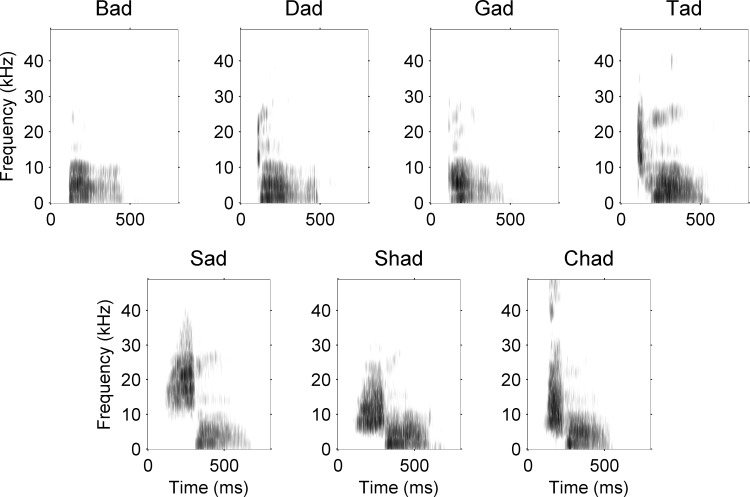
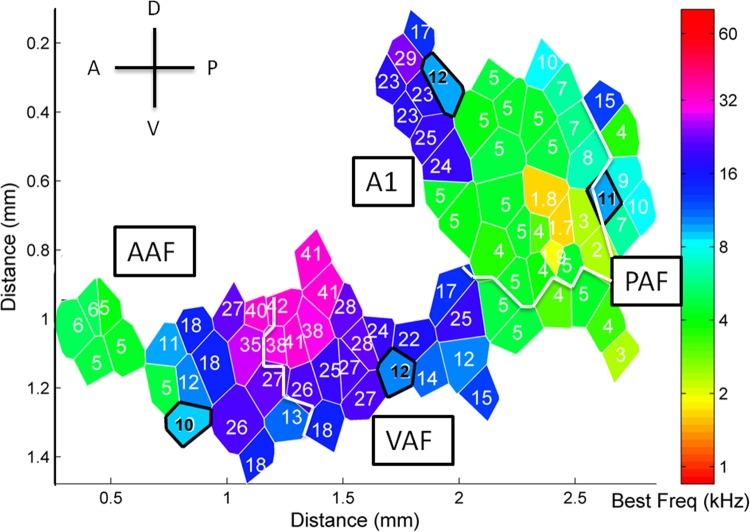
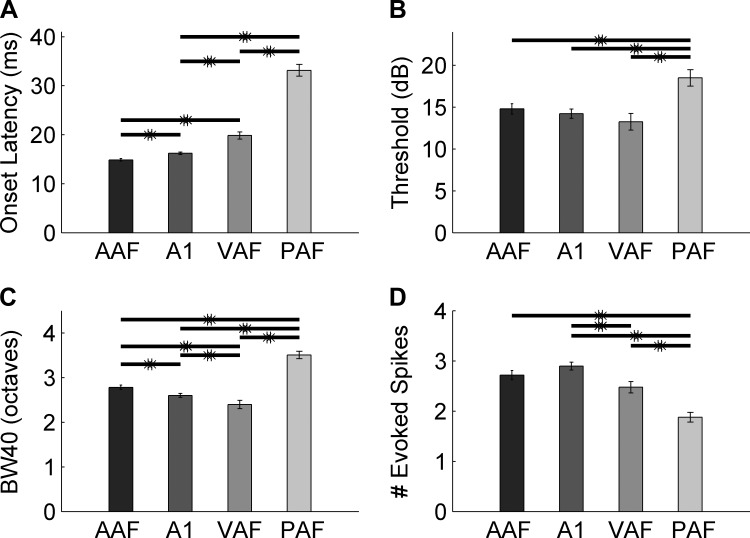
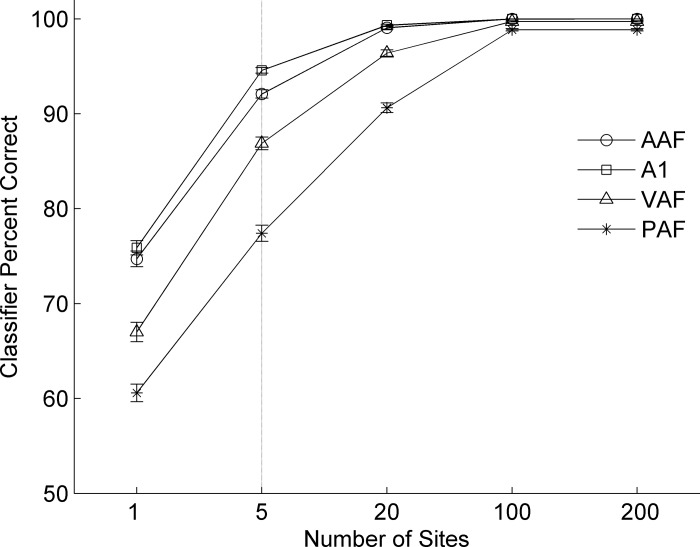
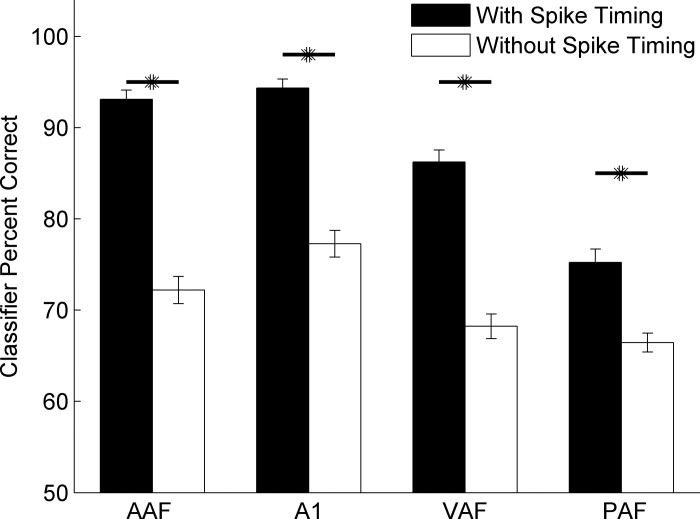
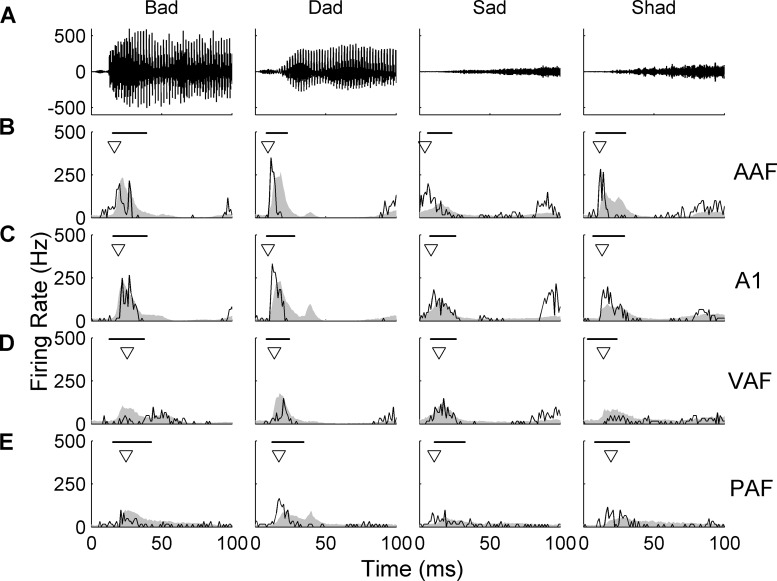
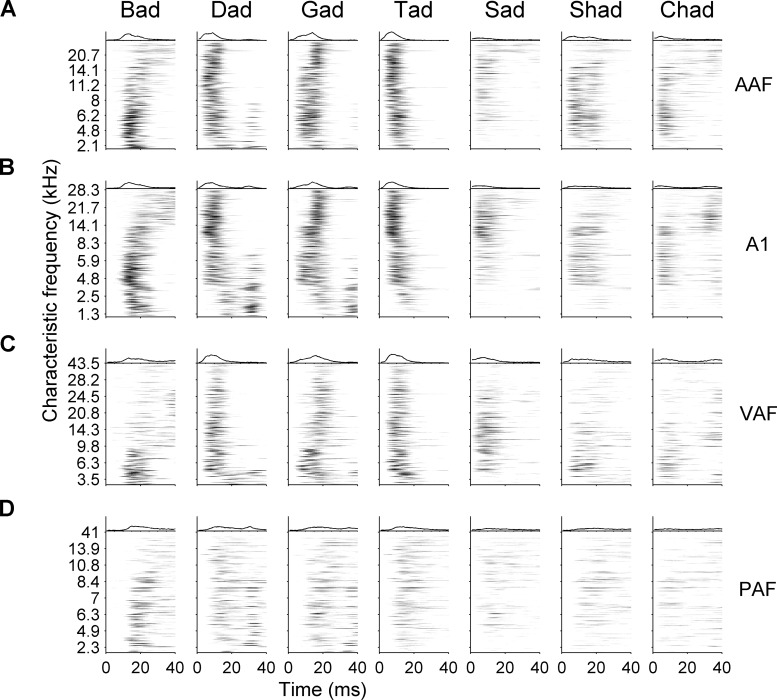
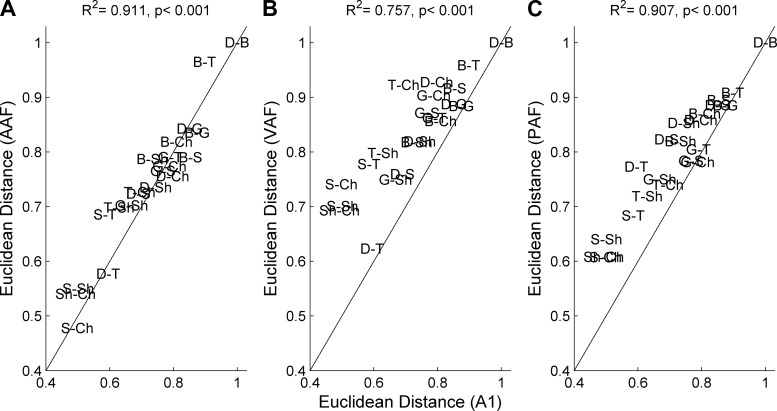
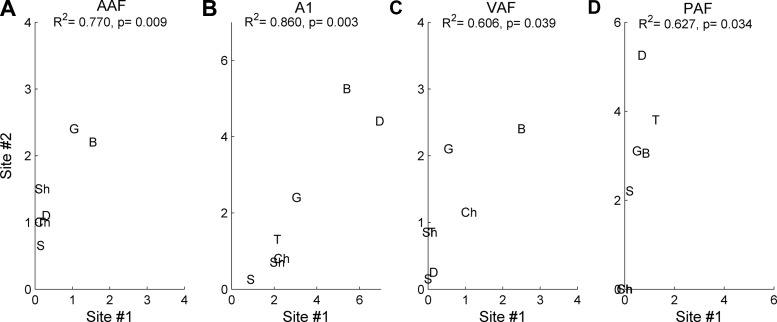
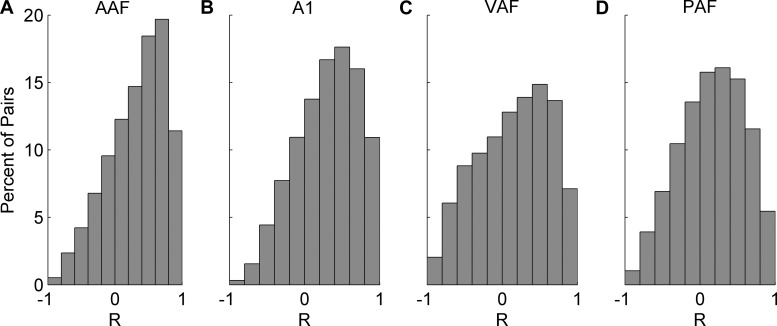
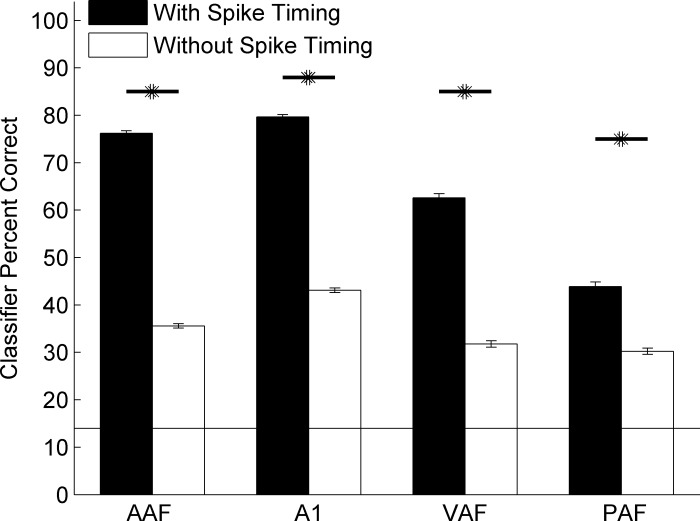
Different speech sounds evoke unique patterns of activity in primary auditory cortex (A1). Behavioral discrimination by rats is well correlated with the distinctness of the A1 patterns evoked by individual consonants, but only when precise spike timing is preserved. In this study we recorded the speech-evoked responses in the primary, anterior, ventral, and posterior auditory fields of the rat and evaluated whether activity in these fields is better correlated with speech discrimination ability when spike timing information is included or eliminated. Spike timing information improved consonant discrimination in all four of the auditory fields examined. Behavioral discrimination was significantly correlated with neural discrimination in all four auditory fields. The diversity of speech responses across recordings sites was greater in posterior and ventral auditory fields compared with A1 and anterior auditor fields. These results suggest that, while the various auditory fields of the rat process speech sounds differently, neural activity in each field could be used to distinguish between consonant sounds with accuracy that closely parallels behavioral discrimination. Earlier observations in the visual and somatosensory systems that cortical neurons do not rely on spike timing should be reevaluated with more complex natural stimuli to determine whether spike timing contributes to sensory encoding.

Keywords: auditory cortex; diversity; parallel hierarchy; rat; spike timing.


Figures

Fig. 1.
Fig. 1.
Speech sound stimuli were shifted up by an octave. Spectrograms of the seven consonant speech sounds that we used in the present study are shown. Since the rat audiogram is considerably higher than the human audiogram, we shifted speech sounds up by an octave, preserving all other spectral and temporal information using the STRAIGHT vocoder (Kawahara 1997; see methods).
Fig. 2.
Fig. 2.
Example of an auditory cortex map from one anesthetized, adult rat. Microelectrode recordings were acquired from layer IV/V of 15 experimentally naive rats. We recorded responses from each of four fields: anterior (AAF), primary (A1), ventral (VAF), and posterior auditory fields (PAF). Although there is variability between animals, tonotopic organization and latency were generally consistent within the fields, and these parameters were used to identify boundaries between fields. AAF was organized from low-frequency sites to high-frequency in an anterior-to-posterior direction, while A1 was organized from low to high in a posterior-to-anterior direction. VAF was located anatomically between the two fields, but had no tonotopic gradient. PAF was located posterior to A1 and also had no tonotopic gradient. Sites outlined in black and with black text represent the individual examples shown in Fig. 6.
Fig. 3.
Fig. 3.
Tone response properties in AAF, A1, VAF, and PAF mimic previous studies. A: AAF and A1 responded to tones with the shortest onset latency (14.8 ± 0.6 ms and 16.2 ± 0.2 ms; P < 0.01), followed by VAF (19.8 ± 0.8 ms; t-test vs. A1, P < 0.01). PAF fired with the longest onset latency of any field and was significantly different from every other field (33.1.2 ± 1.2 ms; t-test vs. VAF, P < 0.01). B: A1, AAF, and VAF responded to tones with the same threshold (14.2 ± 0.5 dB, 14.8 ± 0.6 dB, and 13.2 ± 1 dB, respectively), while PAF sites had a significantly higher threshold than the other three fields (18.1 ± 1.0 dB; t-tests with Bonferroni correction, P < 0.01). C: VAF had the narrowest bandwidths at 40 dB (BW40) above threshold (2.4 ± 0.1 octaves), followed by A1 (2.6 ± 0.1 octaves, t-test vs. VAF, P < 0.01). AAF had broader bandwidths than VAF and A1 (2.8 ± 0.1 octaves, unpaired t-tests with Bonferroni correction, P = 0.01), and PAF had the broadest bandwidths at this intensity level (3.5 ± 0.1 octaves, unpaired t-tests with Bonferroni correction, P < 0.01). D: A1 and AAF fired the most driven spikes to tones (2.8 ± 0.1 spikes and 2.7 ± 0.1 spikes, respectively; t-test, P = 0.14). VAF fired significantly fewer spikes than AAF (2.4 ± 0.1 spikes, P < 0.01), and PAF fired the least amount of driven spikes of any field (1.9 ± 0.1 spikes; t-tests with Bonferroni correction, P < 0.01). *Significant difference.
Fig. 4.
Fig. 4.
Classifier performance by auditory field as a function of number of sites. The two-alternative forced choice classifier reached ceiling performance in all fields when greater than 20 sites are used, while performance was close to floor when single sites are used. For the analyses in this report, we used 5 sites per classifier run (marked by the vertical line) to achieve performance well above chance level while avoiding ceiling performance. Classifier was run in all instances using spike timing information: 1-ms temporal bins across a 40-ms analysis window.
Fig. 5.
Fig. 5.
Neural classifier performance in each auditory field with and without spike timing information. Neural activity in AAF, A1, VAF, and PAF was all better able to discriminate pairs of consonant speech sounds when spike timing information was preserved than when spike timing information was removed. Classifier performance plotted is the average of many groups of 5 random sites performing neural discrimination of 21 different consonant pairs (see methods). In AAF, the classifier achieved 93.1 ± 1.0% correct when spike timing information was preserved vs. 72.2 ± 1.5% correct when spike timing information was removed (P < 0.01). In A1, the classifier achieved 94.4 ± 1.0% correct vs. 77.3 ± 1.5% (P < 0.01). In VAF, the classifier achieved 86.2 ± 1.3% correct vs. 68.2 ± 1.4%, P < 0.01. In PAF, the classifier achieved 75.2 ± 1.4% correct vs. 66.5 ± 1.0%, P < 0.01. All t-tests reported tested classifier performance with and without spike timing, respectively. Values are means ± SE across groups of 5 recording sites. *Significant difference.
Fig. 6.
Fig. 6.
Single-site examples of the evoked-response to consonant speech sounds in each auditory field. Average response (from an ∼10-kHz site in each field) to 20 repeats of each of four consonant speech sounds compared with the average poststimulus response histogram (PSTH) response in each field. The individual site examples are plotted in black, and the population PSTH for the entire field is plotted in gray for comparison. Onset latency for the individual site is marked by a triangle, and the mean ± standard deviation of the latencies for each site in the population is marked by the black bar. A: waveforms of four example consonant speech sounds: two voiced consonants, /b/ and /d/, and two unvoiced consonants, /s/ and /sh/. B: single-site PSTH of a representative AAF site. AAF sites responded quickly to the onset of a speech stimulus in a well-defined peak of activity (average onset latency of 14.2 ± 0.7 ms; mean ± SE). C: PSTH responses from a representative A1 site. Like AAF sites, A1 sites responded quickly to the onset of a stimulus and had a short peak response (15.2 ± 0.7 ms in A1; t-test vs. AAF, P = 0.32). D: PSTH responses from a representative VAF site. This result was similar to the longer latency seen in response to tones. E: PSTH responses from a representative PAF site. Just as PAF sites responded last to tones (compared with the other three fields), this field also responded last to speech sounds (18.1 ± 0.7 ms across all speech sounds; t-test vs. A1, P < 0.01).
Fig. 7.
Fig. 7.
Spatiotemporal response patterns to all consonant speech sounds tested in AAF, A1, VAF, and PAF. Average response to speech sounds from each site in each field are shown, organized by characteristic frequency. The average response across all sites is shown on top of each subpanel. The average response plotted is the same as is shown in gray in Fig. 6. A: AAF sites responded strongly to all speech sounds, but responded less strong for nonstop consonants (/s/, /sh/, and /ch/). Each speech sound evoked a unique pattern of response. For example, the sound /b/ caused low-frequency sites to fire first, followed by high. The consonant /d/ caused the opposite firing pattern. B: A1 responses to speech sounds were similar to AAF and mimic previous recordings in A1. Like AAF, A1 sites responded more strongly to stop consonants. C: VAF did not have as many low-frequency sites as AAF or A1, which caused the response patterns to appear more similar. In spite of the bias in characteristic frequency, VAF sites tuned below 6 kHz did respond to the vowel portion of the speech sounds in a manner that mimicked AAF and A1 responses. D: PAF sites were more broadly tuned than the other three fields. As a result, each site responded to both the consonant onset as well as the vowel onset.
Fig. 8.
Fig. 8.
Similarity between neural responses to speech sounds is highly correlated across fields. Euclidean distance was calculated between the neural responses in each field to every pair of consonant sounds. The similarity between neural responses to speech sounds was then compared between every combination of fields. In general, /d/ and /b/ were the most distinct, and /s/ and /ch/ were the least distinct. Despite some variation, the correlation between fields was high and significant. Not all comparisons are shown. A: the similarity between the neural response to pairs of speech-evoked responses is highly correlated between A1 and AAF (R2 = 0.91, P < 0.01). These two fields perform the neural discrimination task with comparable accuracy. B: the similarity between pairs of speech-evoked neural responses between A1 and VAF is highly correlated (R2 = 0.76, P < 0.01), but the correlation contains more outliers than the AAF/A1 comparison. VAF is better able to discriminate between unvoiced consonants (for example, S/T and S/Ch) than A1. This difference in the similarity between response patterns does not give VAF an advantage for these tasks in the neural discrimination task. C: the similarity between pairs of speech-evoked neural responses between A1 and PAF is as strongly correlated as A1 and AAF (R2 = 0.91, P < 0.01). The neural responses in PAF are more distinct than in A1. This difference does not give PAF an advantage for these tasks in the neural discrimination classifier.
Fig. 9.
Fig. 9.
Example correlations from one pair of sites in each field. We counted the number of evoked spikes to each speech sound fired from each of two sites that were tuned within one-fourth octave of each other and quantified these pairs using the correlation coefficient. These examples represent pairs in the 75th percentile in each field. A: AAF sites fire with a similar number of spikes per sound. For example, both of these sites fired the most spikes to /b/ and /g/, and the least number of spikes to /s/. This example had an R2 of 0.77 (P < 0.01). B: A1 pairs had the highest correlation, suggesting the largest amount of redundant information. This pair had an R2 of 0.86 (P < 0.01). VAF (R2 of 0.61, P = 0.04; C) and PAF (R2 of 0.63, P = 0.03; D) pairs had weak correlations, suggesting that these fields had less redundancy in information encoding. For example, in both C and D, one site in the pair fired more spikes to /g/ than the other site in the pair.
Fig. 10.
Fig. 10.
Distribution of correlation coefficients between speech-evoked responses in pairs of recording sites. In each field, we found pairs of sites tuned within one-fourth octave of each other and compared the number of evoked spikes to each of the seven consonant sounds presented. We quantified these comparisons using the correlation coefficient. A: pairs of sites in AAF were strongly correlated with each other when comparing the number of evoked spikes to speech sounds. AAF site pairs had an average R value of 0.33. B: A1 pairs were the most correlated with each other (an average R value of 0.36, t-test vs. AAF, P < 0.01). VAF (C) and PAF (D) pairs were the least correlated, with an average R value of 0.17 in VAF and 0.18 in PAF. Both of these fields were less correlated than AAF or A1 (t-tests with Bonferroni correction, P < 0.01), but were not different from each other (P = 0.04).
Fig. 11.
Fig. 11.
Neural activity from multiple fields can identify consonant sounds better when spike timing information is preserved. We ran the classifier using templates for all 7 sounds simultaneously to test the ability of neural activity to identify the 7 sounds with and without spike timing information. All four fields were significantly better at the identification task when spike timing information was preserved (black bars) than when spike timing information was removed (white bars; *P < 0.001). AAF was most affected by the removal of spike timing (i.e., had the greatest difference in performance across the two conditions), followed by A1, VAF, and PAF (P < 0.001).

Similar articles

Cited by

References

    1. Ahissar E, Sosnik R, Haidarliu S. Transformation from temporal to rate coding in a somatosensory thalamocortical pathway. Nature 406: 302–306, 2000 - PubMed
    1. Anderson S, Kilgard M, Sloan A, Rennaker R. Response to broadband repetitive stimuli in auditory cortex of the unanesthetized rat. Hear Res 213: 107–117, 2006 - PubMed
    1. Barbour DL, Wang X. Contrast tuning in auditory cortex. Science 299: 1073–1075, 2003 - PMC - PubMed
    1. Buonomano DV, Merzenich MM. Temporal information transformed into a spatial code by a neural network with realistic properties. Science 267: 1028–1030, 1995 - PubMed
    1. Carrasco A, Lomber SG. Neuronal activation times to simple, complex, and natural sounds in cat primary and nonprimary auditory cortex. J Neurophysiol 106: 1166–1178, 2011 - PubMed

Publication types

LinkOut - more resources