Neighborhood-level hot spot maps to inform delivery of primary care and allocation of social resources
- PMID: 23596361
- PMCID: PMC3627788
- DOI: 10.7812/TPP/12-090
Neighborhood-level hot spot maps to inform delivery of primary care and allocation of social resources
Abstract
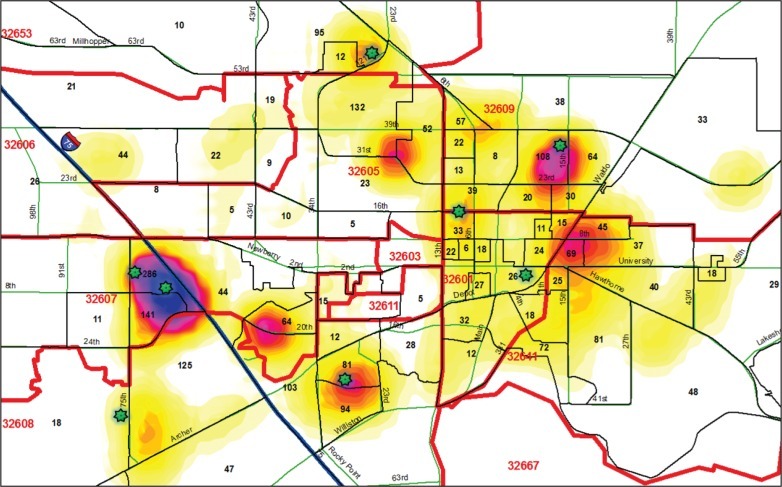
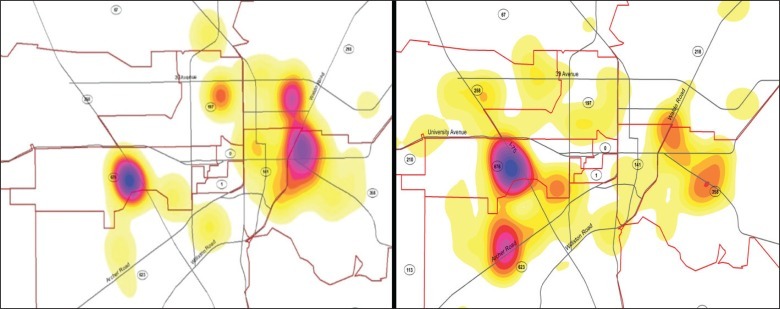
Challenges to health care access in the US are forcing local policymakers and service delivery systems to find novel ways to address the shortage of primary care clinicians. The uninsured and underinsured face the greatest obstacles in accessing services. Geographic information systems mapping software was used to illustrate health disparities in Alachua County, FL; galvanize a community response; and direct reallocation of resources. The University of Florida Family Data Center created "hot spot" density maps of important health and social indicators to highlight the location of disparities at the neighborhood level. Maps were produced for Medicaid births, teen births, low birth weight, domestic violence incidents, child maltreatment reports, unexcused school absences, and juvenile justice referrals. Maps were widely shared with community partners, including local elected officials, law enforcement, educators, child welfare agencies, health care providers, and service organizations. This data sharing resulted in advocacy efforts to bring resources to the greatest-need neighborhoods in the county. Novel public-private partnerships were forged between the local library district, children and family service providers, and university administrators. Two major changes are detailed: a family resource center built in the neighborhood of greatest need and a mobile clinic staffed by physicians, nurses, physician assistants, health educators, and student and faculty volunteers. Density maps have several advantages. They require minimal explanation. Anyone familiar with local geographic features can quickly identify locations displaying health disparities. Personalizing health disparities by locating them geographically allows a community to translate data to action to improve health care access.
Figures

References
-
- The Patient Protection and Affordable Care Act of 2010. Public Law 111-148, 111th Congress, 124 Stat 119, HR 3590, enacted 2010 Mar 23
-
- Committee on Using Performance Monitoring to Improve Community Health, Institute of Medicine. Durch JS, Bailey LA, Stoto MA. Improving health in the community: a role for performance monitoring. Washington, DC: The National Academies Press; 1997. - PubMed
-
- Kruger DJ, Brady JS, Shirey LA. Using GIS to facilitate community-based public health planning of diabetes intervention efforts. Health Promot Pract. 2008 Jan;9(1):76–81. DOI: http://dx.doi.org/10.1177/1524839906293396. - DOI - PubMed
-
- Cromley EK. GIS and disease. Annu Rev Public Health. 2003;24:7–24. DOI: http://dx.doi.org/10.1146/annurev.publhealth.24.012902.141019. - DOI - PubMed
Publication types
MeSH terms
LinkOut - more resources
Full Text Sources
Other Literature Sources
Medical