

On the dynamics of cortical development: synchrony and synaptic self-organization
- PMID: 23596410
- PMCID: PMC3573321
- DOI: 10.3389/fncom.2013.00004
On the dynamics of cortical development: synchrony and synaptic self-organization
Abstract
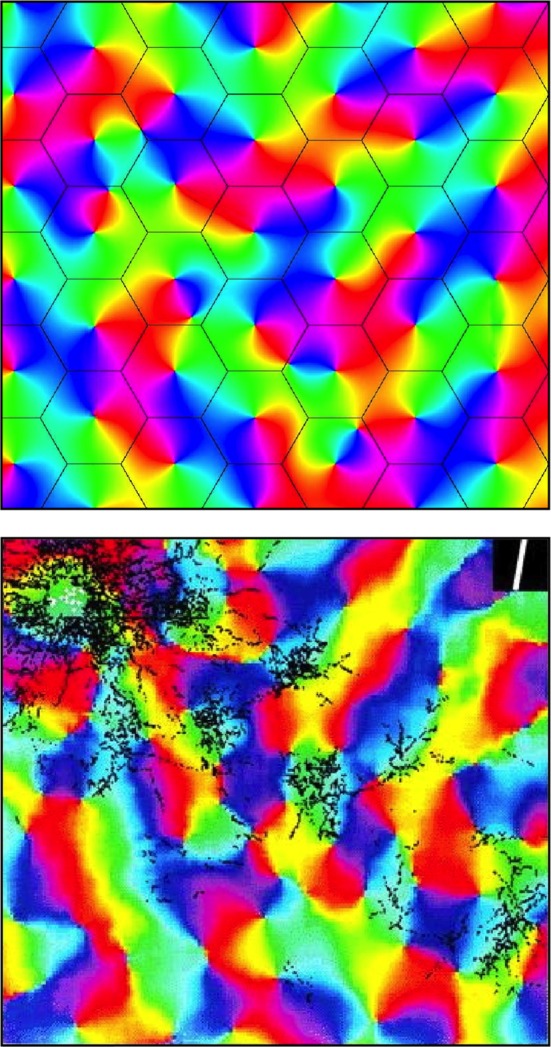
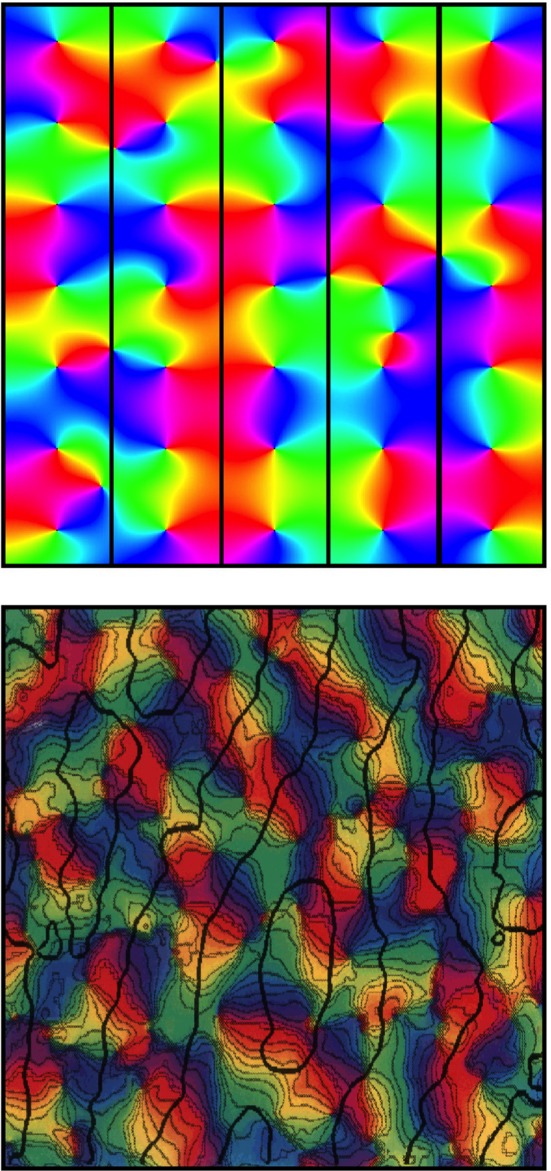
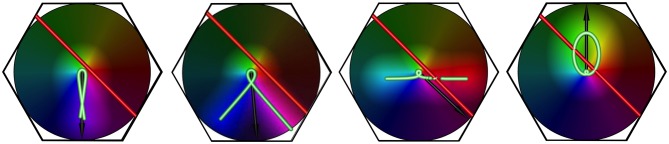
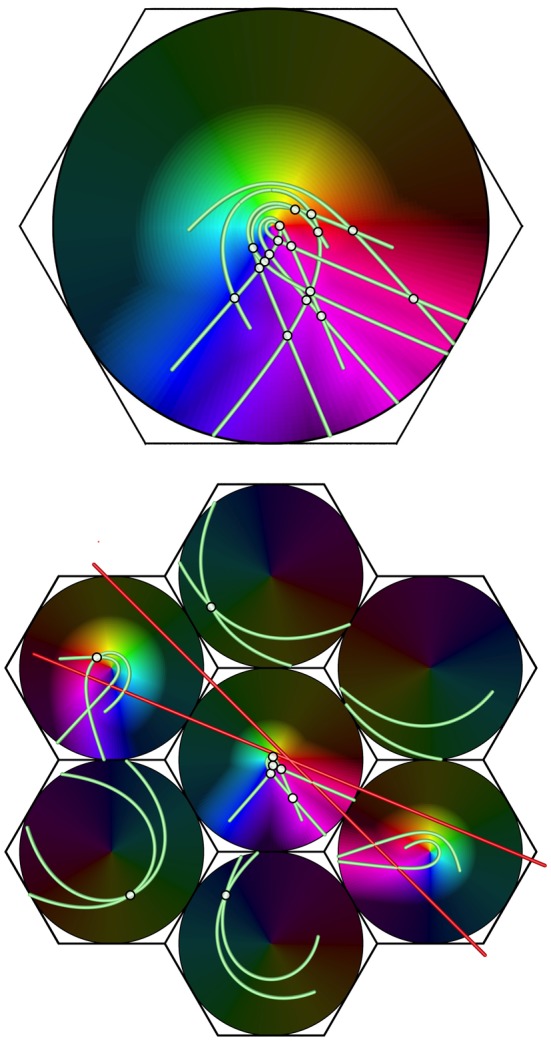
We describe a model for cortical development that resolves long-standing difficulties of earlier models. It is proposed that, during embryonic development, synchronous firing of neurons and their competition for limited metabolic resources leads to selection of an array of neurons with ultra-small-world characteristics. Consequently, in the visual cortex, macrocolumns linked by superficial patchy connections emerge in anatomically realistic patterns, with an ante-natal arrangement which projects signals from the surrounding cortex onto each macrocolumn in a form analogous to the projection of a Euclidean plane onto a Möbius strip. This configuration reproduces typical cortical response maps, and simulations of signal flow explain cortical responses to moving lines as functions of stimulus velocity, length, and orientation. With the introduction of direct visual inputs, under the operation of Hebbian learning, development of mature selective response "tuning" to stimuli of given orientation, spatial frequency, and temporal frequency would then take place, overwriting the earlier ante-natal configuration. The model is provisionally extended to hierarchical interactions of the visual cortex with higher centers, and a general principle for cortical processing of spatio-temporal images is sketched.
Keywords: cortical development; cortical information flow; cortical response properties; synaptic organization; synchronous oscillation.
Figures


Similar articles
-
Further Work on the Shaping of Cortical Development and Function by Synchrony and Metabolic Competition.Front Comput Neurosci. 2016 Dec 9;10:127. doi: 10.3389/fncom.2016.00127. eCollection 2016. Front Comput Neurosci. 2016. PMID: 28018202 Free PMC article.
-
An outline of functional self-organization in V1: synchrony, STLR and Hebb rules.Cogn Neurodyn. 2008 Jun;2(2):147-57. doi: 10.1007/s11571-008-9048-y. Epub 2008 Apr 19. Cogn Neurodyn. 2008. PMID: 19003481 Free PMC article.
-
Functional mapping of horizontal connections in developing ferret visual cortex: experiments and modeling.J Neurosci. 1994 Dec;14(12):7291-305. doi: 10.1523/JNEUROSCI.14-12-07291.1994. J Neurosci. 1994. PMID: 7996176 Free PMC article.
-
The growth of cognition: Free energy minimization and the embryogenesis of cortical computation.Phys Life Rev. 2021 Mar;36:83-99. doi: 10.1016/j.plrev.2020.05.004. Epub 2020 Jun 1. Phys Life Rev. 2021. PMID: 32527680 Review.
-
Geometric visual hallucinations, Euclidean symmetry and the functional architecture of striate cortex.Philos Trans R Soc Lond B Biol Sci. 2001 Mar 29;356(1407):299-330. doi: 10.1098/rstb.2000.0769. Philos Trans R Soc Lond B Biol Sci. 2001. PMID: 11316482 Free PMC article. Review.
Cited by
-
Symbolic Modeling of Asynchronous Neural Dynamics Reveals Potential Synchronous Roots for the Emergence of Awareness.Front Comput Neurosci. 2019 Feb 12;13:1. doi: 10.3389/fncom.2019.00001. eCollection 2019. Front Comput Neurosci. 2019. PMID: 30809141 Free PMC article.
-
Cortical Thinning in Healthy Aging Correlates with Larger Motor-Evoked EEG Desynchronization.Front Aging Neurosci. 2016 Mar 29;8:63. doi: 10.3389/fnagi.2016.00063. eCollection 2016. Front Aging Neurosci. 2016. PMID: 27064767 Free PMC article.
-
Möbius-strip-like columnar functional connections are revealed in somato-sensory receptive field centroids.Front Neuroanat. 2014 Oct 31;8:119. doi: 10.3389/fnana.2014.00119. eCollection 2014. Front Neuroanat. 2014. PMID: 25400552 Free PMC article.
-
Modeling the Synchronization of Multimodal Perceptions as a Basis for the Emergence of Deterministic Behaviors.Front Neurorobot. 2020 Dec 3;14:570358. doi: 10.3389/fnbot.2020.570358. eCollection 2020. Front Neurorobot. 2020. PMID: 33424574 Free PMC article.
-
Use it and/or lose it-experience effects on brain remodeling across time after stroke.Front Hum Neurosci. 2014 Jun 27;8:379. doi: 10.3389/fnhum.2014.00379. eCollection 2014. Front Hum Neurosci. 2014. PMID: 25018715 Free PMC article. Review.
References
-
- Amari S.-I. (1977). Dynamics of pattern formation in lateral-inhibition type neural fields. Biol. Cybern. 27, 77–87 - PubMed
-
- Angelucci A., Levitt J. B., Lund J. S. (2002). Anatomical origins of the classic receptive field and modulatory surround field of single neurons in macaque visual cortical area V1. Prog. Brain Res. 136, 373–388 - PubMed
LinkOut - more resources
Full Text Sources
Other Literature Sources