. 2013 Apr 11:3:79.
doi: 10.3389/fonc.2013.00079. eCollection 2013.

Expression of the Pluripotency Transcription Factor OCT4 in the Normal and Aberrant Mammary Gland

Affiliations

Expression of the Pluripotency Transcription Factor OCT4 in the Normal and Aberrant Mammary Gland

Foteini Hassiotou et al. Front Oncol. .

Abstract

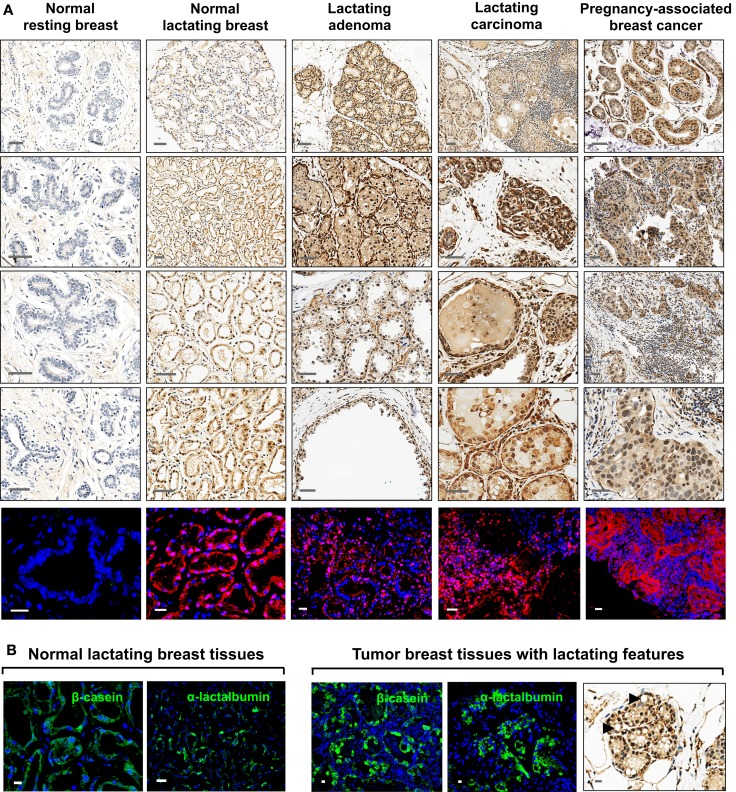
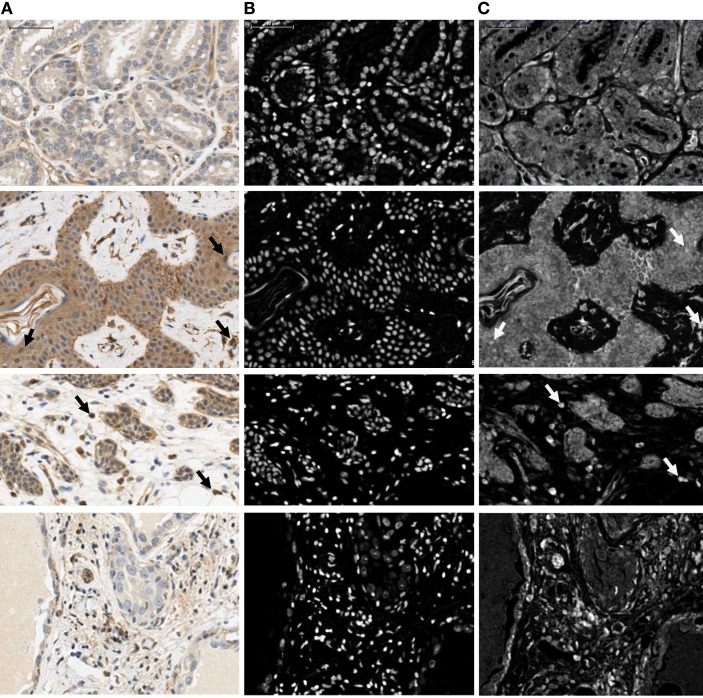
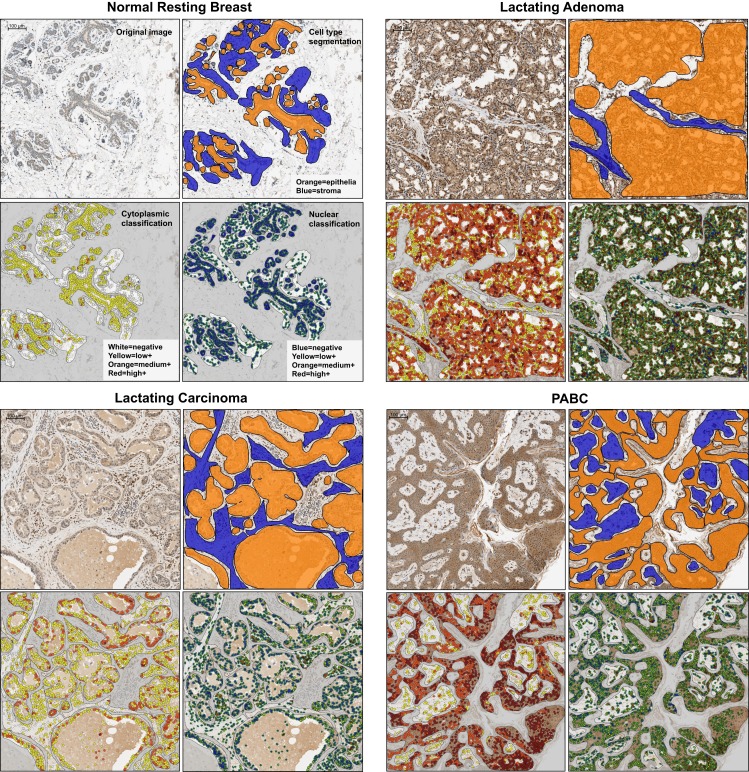
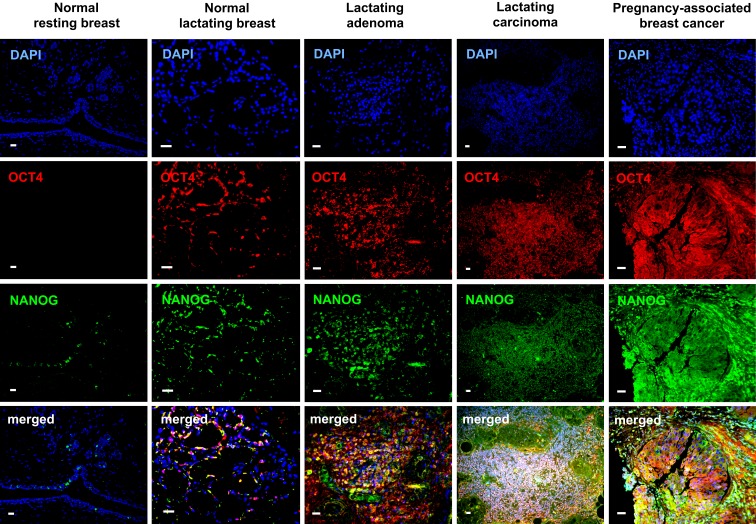
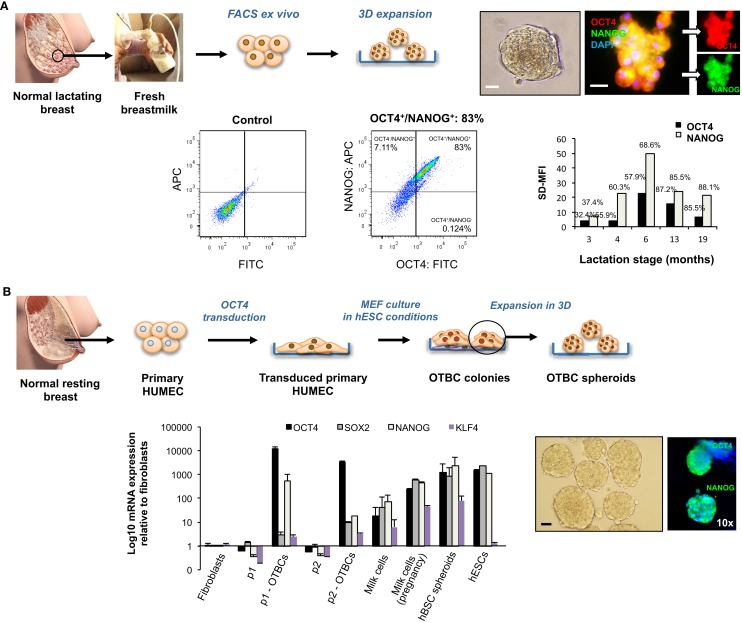
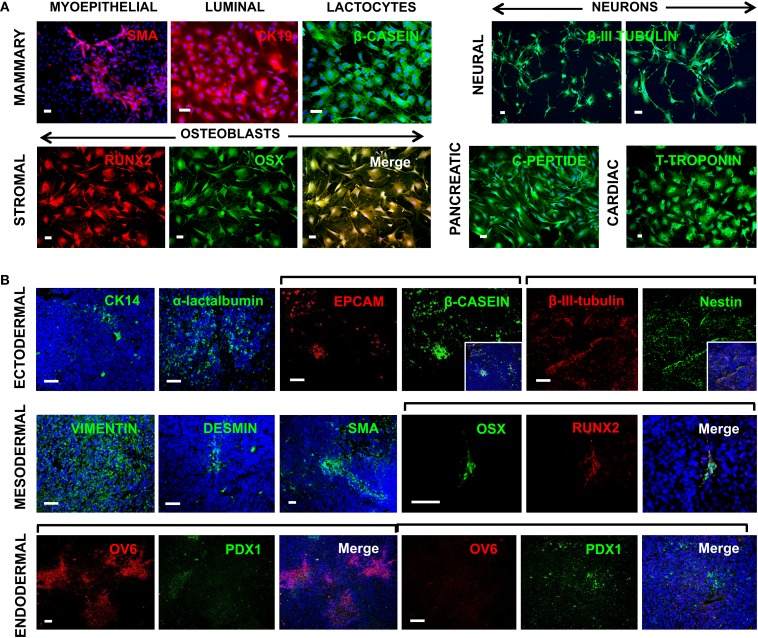
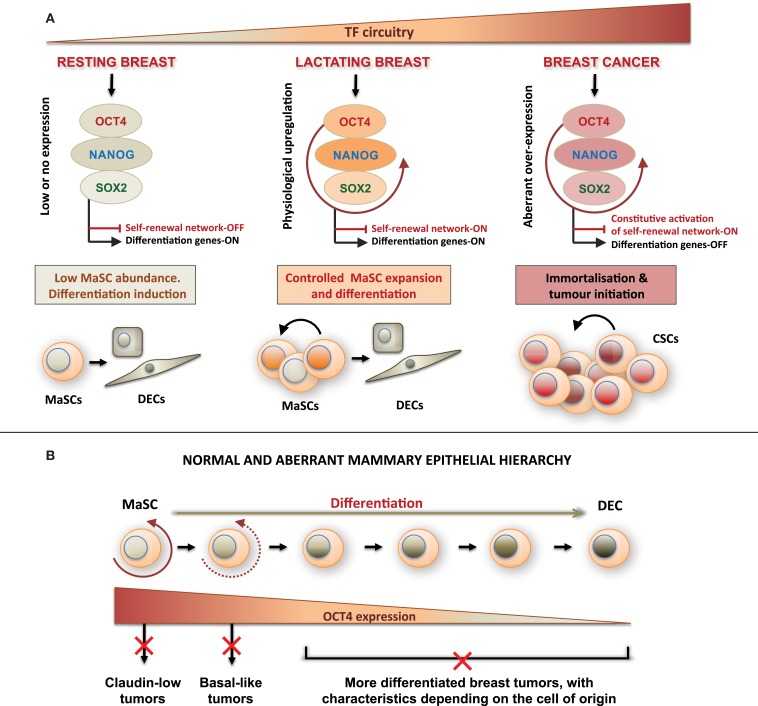
Breast cancers with lactating features, some of which are associated with pregnancy and lactation, are often poorly differentiated, lack estrogen receptor, progesterone receptor, and HER2 expression and have high mortality. Very little is known about the molecular mechanisms that drive uncontrolled cell proliferation in these tumors and confer lactating features. We have recently reported expression of OCT4 and associated embryonic stem cell self-renewal genes in the normal lactating breast and breastmilk stem cells (hBSCs). This prompted us to examine OCT4 expression in breast cancers with lactating features and compare it with that observed during normal lactation, using rare specimens of human lactating breast. In accordance with previous literature, the normal resting breast (from non-pregnant, non-lactating women) showed minimal OCT4 nuclear expression (0.9%). However, this increased in the normal lactating breast (11.4%), with further increase in lactating adenomas, lactating carcinomas, and pregnancy-associated breast cancer (30.7-48.3%). OCT4 was expressed in the epithelium and at lower levels in the stroma, and was co-localized with NANOG. Comparison of normal non-tumorigenic hBSCs with OCT4-overexpressing tumorigenic breast cell lines (OTBCs) demonstrated upregulation of OCT4, SOX2, and NANOG in both systems, but OTBCs expressed OCT4 at significantly higher levels than SOX2 and NANOG. Similar to hBSCs, OTBCs displayed multi-lineage differentiation potential, including the ability to differentiate into functional lactocytes synthesizing milk proteins both in vitro and in vivo. Based on these findings, we propose a hypothesis of normal and malignant transformation in the breast, which centers on OCT4 and its associated gene network. Although minimal expression of these embryonic genes can be seen in the breast in its resting state throughout life, a controlled program of upregulation of this gene network may be a potential regulator of the normal remodeling of the breast toward a milk-secretory organ during pregnancy and lactation. Deregulation of this gene network either within or outside pregnancy and lactation may lead to aberrant breast cell proliferation and malignant transformation, suggesting a role of these genes in both normal lactation and breast oncogenesis.

Keywords: OCT4; adult stem cell; breast cancer; breastmilk; cancer stem cell; mammary gland; self-renewal; transcription factors.


Figures

Figure 1
Figure 1
Expression of OCT4 in the normal resting and lactating breast, and in breast tumors with lactating features or associated with pregnancy and lactation. (A) IHC and IF staining of OCT4. Scale bars: 50 μm (IHC) and 20 μm (IF). Minimal and mostly cytoplasmic expression was seen in the normal resting breast. During normal lactation, OCT4 was upregulated and expressed in both the nucleus and cytoplasm, with varying expression and subcellular localization between different tissues, and between different lobules and alveoli within the same tissue. Enhanced expression was observed in breast tumors with lactating features or associated with pregnancy and lactation. In addition to the epithelium, some expression was seen in the mammary stroma. (B) The lactating features of the examined normal lactating and tumor tissues were confirmed via IF staining for milk proteins and the presence of lipid droplets in the epithelium. Scale bars: 10 μm.
Figure 2
Figure 2
Illustration showing part of the four image regions used for optimization of nuclear and cytoplasmic sizes, shapes, and IHC thresholds. Regions were chosen to include the range of cytoplasmic and nuclear intensities that were present in the complete image data set. Raw images (A) and corresponding nuclear [hematoxylin; (B)] and IHC [DAB; (C)] stained layers are shown. Arrows indicate examples of positive nuclei. Scale bar: 50 μm.
Figure 3
Figure 3
Representative examples of the examined tissues showing cell type segmentation and cytoplasmic and nuclear classification for different staining intensities used for quantification of OCT4 expression in the epithelium and in the stroma. For each sample type, the top left panel is the raw image; the top right illustrates the epithelial/stromal segmentation with orange representing epithelial regions and blue the stromal regions; the bottom left panel shows the cytoplasmic classification, with white: negative cytoplasm, yellow: low positive cytoplasm, orange: medium positive cytoplasm, red: highly positive cytoplasm; the bottom right panel shows the nuclear classification, with blue: negative nucleus, yellow: low positive nucleus, orange: medium positive nucleus, red: highly positive nucleus. PABC: pregnancy-associated breast cancer. Scale bars: 100 μm.
Figure 4
Figure 4
Quantification of OCT4 expression in the epithelium and stroma of normal and tumor breast tissues. (A) Levels of expression in the nucleus and cytoplasm between tissue types. Boxes show first and third quartiles, horizontal bars within boxes indicate median values, and “whiskers” show the range of values. Seminoma was used as positive control. (B) Column charts showing contribution of the different expression levels (low, medium, and high) to the total expression for each tissue type. Significance is shown with stars, whereby black stars compare the respective tissue with the normal resting breast and red stars with the normal lactating breast. Normal human resting breast: N = 2; normal human lactating breast: N = 6; lactating breast adenomas: N = 7; lactating breast carcinomas: N = 3; pregnancy-associated breast cancer (PABC): N = 1. P values for overall levels of expression were determined with OLS regression separately for each location and comparison tissue, and are shown as: 0.05 < formula image 
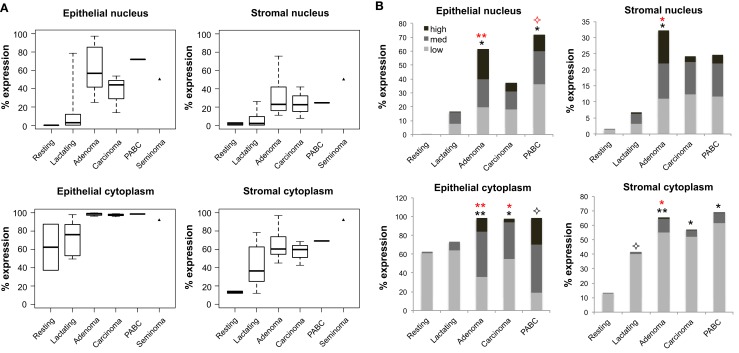
≤ 0.1; 0.01 < * ≤ 0.05; and 0.001 < ** ≤ 0.01.
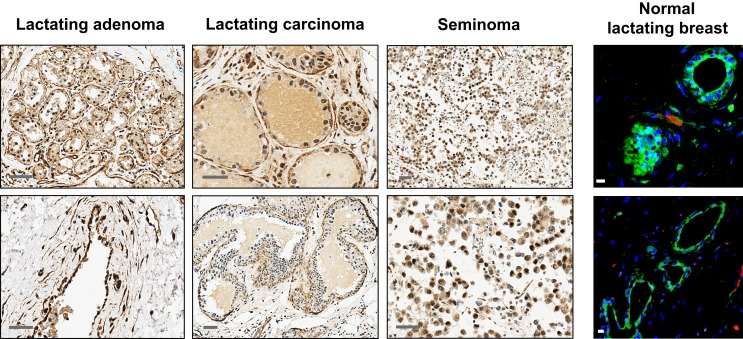
Figure 5
Figure 5
Additional examples of OCT4 expression by IHC and IF in the normal lactating and breast tumor tissues examined. Seminomas were used as positive control. Scale bars: 50 μm (IHC), and 10 μm (IF).
Figure 6
Figure 6
Co-localization of OCT4 (red) and NANOG (green) in the normal lactating breast and in breast tumors with lactating features or associated with pregnancy and lactation. Scale bars: 20 μm. Blue: DAPI stain for nuclei.
Figure 7
Figure 7
Embryonic stem cell transcription factor expression and effects on self-renewal of normal stem cells from the lactating breast and OCT4-overexpressing cancer cells (OTBCs). (A) Normal stem cells of the lactating breast accessed via breastmilk. The panel shows FACS ex vivo analysis of OCT4 and NANOG co-expression in freshly isolated breastmilk cells, and a column chart of the standardized difference in Mean Fluorescence Intensity between the test and the control (SD-MFI), and the% positive cells for each sample (N = 5), each of which represents a different lactation stage. In addition, hBSC spheroids obtained in 3D culture that co-express OCT4 and NANOG are shown. Blue: DAPI nuclear stain. Scale bars: 20 μm. (B) The Workflow of derivation of OCT4-transduced cells (OTBCs) from resting breast cells is shown (adapted from Beltran et al., 2011). The IF images present OTBC spheroids grown in 3D culture expressing OCT4 and NANOG. Blue: DAPI nuclear stain. The column chart compares mRNA expression levels of OCT4, SOX2, NANOG, and KLF4 among parental lines (p1 and p2), OTBC lines (p1-OTBCs, N = 6; and p2-OTBCs, N = 2, respectively), fresh milk cells (N = 16), fresh milk cells during pregnancy [“Milk cells (pregnancy),” N = 1], hBSC spheroids (N = 10–31, depending on the gene), fibroblasts, and hESCs (adapted from Beltran et al., ; Hassiotou et al., 2012). Individual PCR reactions were normalized against GAPDH and plotted relative to the expression level of fibroblasts. Bars represent the mean ± SEM for fibroblasts, parental lines, p2-OTBCs, milk cells-P, and hESCs, and the mean ± SD for p1-OTBCs, milk cells, and hBSC spheroids. Images of normal lactating and resting breasts: ©Medela AG, Switzerland, 2006. Used with Permission.
Figure 8
Figure 8
Multi-lineage differentiation capabilities of OCT4-overexpressing cancer cells (OTBCs). (A) OTBCs directed to differentiate in vitro into myoepithelial SMA+ cells, luminal CK19+ cells, β-casein+ lactocyte-like cells, β-III-tubulin+ neuron-like cells, RUNX2+/OSX+ osteoblast-like cells, c-peptide+ islet-like cells, and T-troponin+ cardiomyocyte-like cells. (B) Tumors formed in nude/SCID mice by OTBCs contained cells from all three germ layers. Blue: DAPI nuclear stain. Scale bars: 50 μm.
Figure 9
Figure 9
Proposed model of mammary cellular hierarchy integrating expression of OCT4 and its associated embryonic stem cell gene network in the regulation of self-renewal, differentiation, and transformation in the breast. (A) The resting breast is characterized by minimal expression of the ESC TF circuitry, which allows maintenance of quiescence and low self-renewal activity in MaSCs. During pregnancy and lactation and under physiologic cues, OCT4 promoter becomes activated effecting transient activation of other ESC TFs and downstream targets. This regulates a controlled program of MaSC expansion and subsequent differentiation. Uncontrolled overexpression of OCT4 and/or its associated ESC TFs leads to oncogenic activation of TFs, transformation, and aberrant expansion of the target cell, which may be a MaSC or a more differentiated cell, and acquisition of a CSC phenotype. (B) Normal and aberrant mammary epithelial hierarchy based on changing expression of OCT4 that determines the cell state in a mammary developmental continuum. Deregulation of OCT4 expression at each developmental state results in cell transformation and generation of different tumor subtypes. DECs, differentiated epithelial cells; CSCs, cancer stem cells.

Similar articles

Cited by

References

    1. Akaogi K., Nakajima Y., Ito I., Kawasaki S., Oie S. H., Murayama A., et al. (2009). KLF4 suppresses estrogen-dependent breast cancer growth by inhibiting the transcriptional activity of ERalpha. Oncogene 28, 2894–290210.1038/onc.2009.151 - DOI - PubMed
    1. Arnold K., Sarkar A., Yram M. A., Polo J. M., Bronson R., Sengupta S., et al. (2011). Sox2(+) adult stem and progenitor cells are important for tissue regeneration and survival of mice. Cell Stem Cell 9, 317–32910.1016/j.stem.2011.09.001 - DOI - PMC - PubMed
    1. Barnes D. M., Newman L. A. (2007). Pregnancy-associated breast cancer: a literature review. Surg. Clin. North Am. 87, 417–43010.1016/j.suc.2007.01.008 - DOI - PubMed
    1. Beltran A. S., Rivenbark A. G., Richardson B. T., Yuan X., Quian H., Hunt J. P., et al. (2011). Generation of tumor-initiating cells by exogenous delivery of OCT4 transcription factor. Breast Cancer Res. 13, R94.10.1186/bcr3019 - DOI - PMC - PubMed
    1. Ben-Porath I., Thomson M. W., Carey V. J., Ge R., Bell G. W., Regev A., et al. (2008). An embryonic stem cell-like gene expression signature in poorly differentiated aggressive human tumors. Nat. Genet. 40, 499–50710.1038/ng.127 - DOI - PMC - PubMed