

Transcriptome characterisation of Pinus tabuliformis and evolution of genes in the Pinus phylogeny
- PMID: 23597112
- PMCID: PMC3640921
- DOI: 10.1186/1471-2164-14-263
Transcriptome characterisation of Pinus tabuliformis and evolution of genes in the Pinus phylogeny
Abstract
Background: The Chinese pine (Pinus tabuliformis) is an indigenous conifer species in northern China but is relatively underdeveloped as a genomic resource; thus, limiting gene discovery and breeding. Large-scale transcriptome data were obtained using a next-generation sequencing platform to compensate for the lack of P. tabuliformis genomic information.
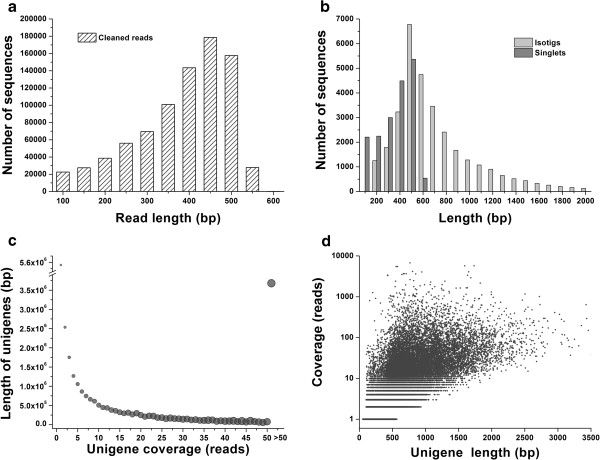
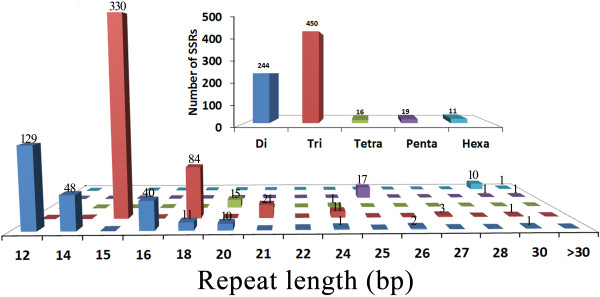
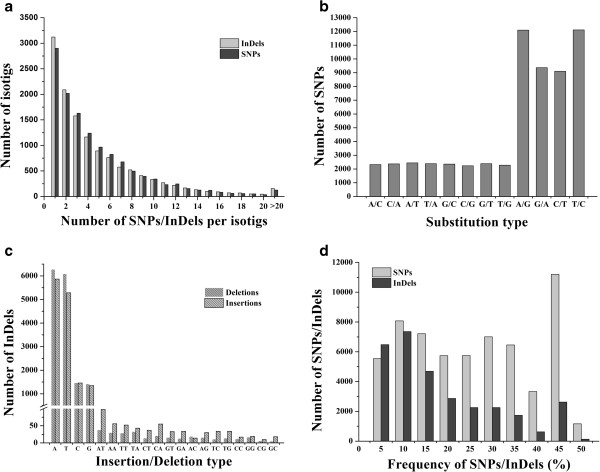
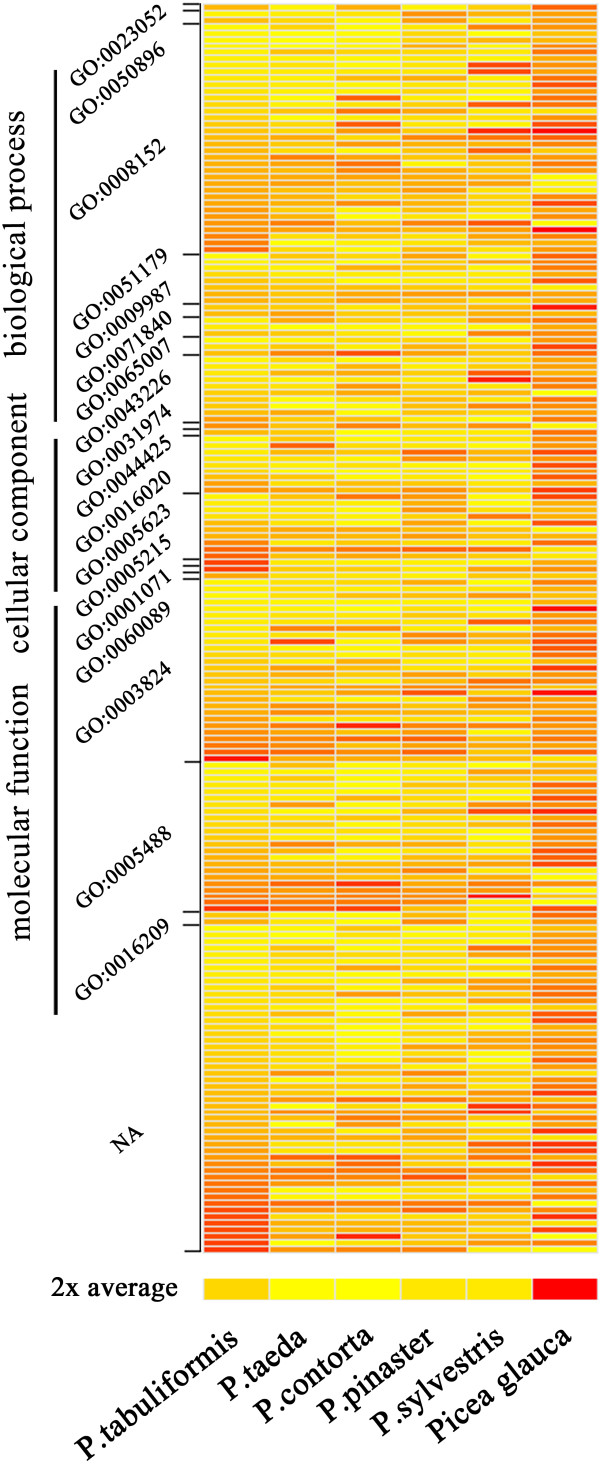
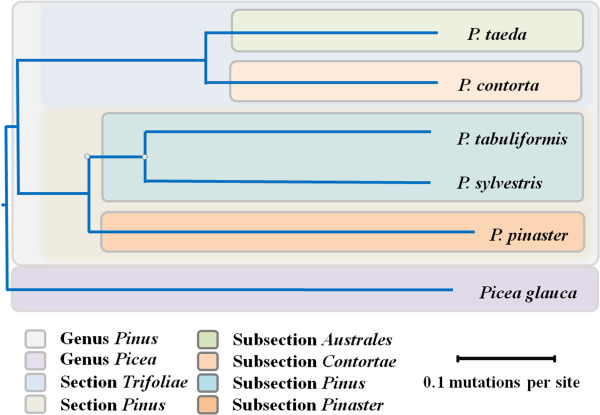
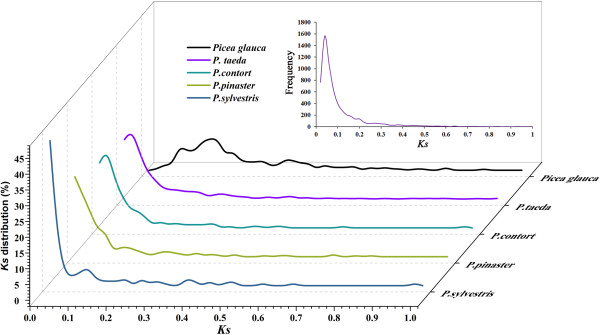
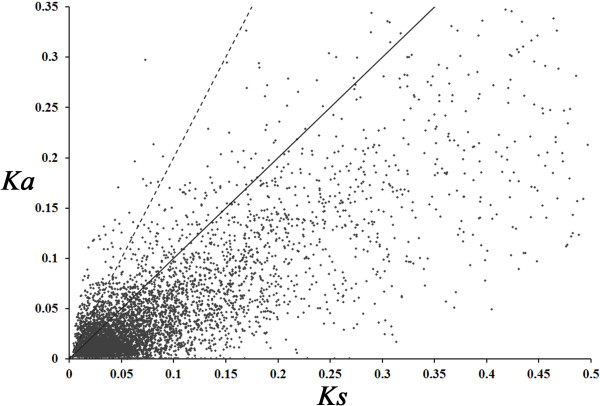
Results: The increasing amount of transcriptome data on Pinus provides an excellent resource for multi-gene phylogenetic analysis and studies on how conserved genes and functions are maintained in the face of species divergence. The first P. tabuliformis transcriptome from a normalised cDNA library of multiple tissues and individuals was sequenced in a full 454 GS-FLX run, producing 911,302 sequencing reads. The high quality overlapping expressed sequence tags (ESTs) were assembled into 46,584 putative transcripts, and more than 700 SSRs and 92,000 SNPs/InDels were characterised. Comparative analysis of the transcriptome of six conifer species yielded 191 orthologues, from which we inferred a phylogenetic tree, evolutionary patterns and calculated rates of gene diversion. We also identified 938 fast evolving sequences that may be useful for identifying genes that perhaps evolved in response to positive selection and might be responsible for speciation in the Pinus lineage.
Conclusions: A large collection of high-quality ESTs was obtained, de novo assembled and characterised, which represents a dramatic expansion of the current transcript catalogues of P. tabuliformis and which will gradually be applied in breeding programs of P. tabuliformis. Furthermore, these data will facilitate future studies of the comparative genomics of P. tabuliformis and other related species.
Figures
Similar articles
-
Transcriptome sequencing of Pinus kesiya var. langbianensis and comparative analysis in the Pinus phylogeny.BMC Genomics. 2018 Oct 3;19(1):725. doi: 10.1186/s12864-018-5127-6. BMC Genomics. 2018. PMID: 30285615 Free PMC article.
-
Characterization of ESTs from black locust for gene discovery and marker development.Genet Mol Res. 2015 Oct 19;14(4):12684-91. doi: 10.4238/2015.October.19.12. Genet Mol Res. 2015. PMID: 26505419
-
Generation, functional annotation and comparative analysis of black spruce (Picea mariana) ESTs: an important conifer genomic resource.BMC Genomics. 2013 Oct 11;14:702. doi: 10.1186/1471-2164-14-702. BMC Genomics. 2013. PMID: 24119028 Free PMC article.
-
Transcriptome sequencing in an ecologically important tree species: assembly, annotation, and marker discovery.BMC Genomics. 2010 Mar 16;11:180. doi: 10.1186/1471-2164-11-180. BMC Genomics. 2010. PMID: 20233449 Free PMC article.
-
De novo assembly of maritime pine transcriptome: implications for forest breeding and biotechnology.Plant Biotechnol J. 2014 Apr;12(3):286-99. doi: 10.1111/pbi.12136. Epub 2013 Nov 21. Plant Biotechnol J. 2014. PMID: 24256179
Cited by
-
An ethylene-induced NAC transcription factor acts as a multiple abiotic stress responsor in conifer.Hortic Res. 2023 Jun 20;10(8):uhad130. doi: 10.1093/hr/uhad130. eCollection 2023 Aug. Hortic Res. 2023. PMID: 37560016 Free PMC article.
-
MADS-box transcription factors MADS11 and DAL1 interact to mediate the vegetative-to-reproductive transition in pine.Plant Physiol. 2021 Sep 4;187(1):247-262. doi: 10.1093/plphys/kiab250. Plant Physiol. 2021. PMID: 34618133 Free PMC article.
-
Genome-Wide Identification of Genes Probably Relevant to the Uniqueness of Tea Plant (Camellia sinensis) and Its Cultivars.Int J Genomics. 2015;2015:527054. doi: 10.1155/2015/527054. Epub 2015 Oct 12. Int J Genomics. 2015. PMID: 26543846 Free PMC article.
-
Application of EST-SSR markers developed from the transcriptome of Torreya grandis (Taxaceae), a threatened nut-yielding conifer tree.PeerJ. 2018 Sep 19;6:e5606. doi: 10.7717/peerj.5606. eCollection 2018. PeerJ. 2018. PMID: 30258714 Free PMC article.
-
Comprehensive Organ-Specific Profiling of Douglas Fir (Pseudotsuga menziesii) Proteome.Biomolecules. 2023 Sep 16;13(9):1400. doi: 10.3390/biom13091400. Biomolecules. 2023. PMID: 37759800 Free PMC article.
References
-
- Ahuja MR, Neale DB. Evolution of genome size in conifers. Silvae Genet. 2005;54(3):126–137.
-
- Fernandez-Pozo N, Canales J, Guerrero-Fernandez D, Villalobos DP, Diaz-Moreno SM, Bautista R, Flores-Monterroso A, Guevara MA, Perdiguero P, Collada C. EuroPineDB: a high-coverage web database for maritime pine transcriptome. BMC Genomics. 2011;12:366. doi: 10.1186/1471-2164-12-366. - DOI - PMC - PubMed
-
- Cairney J, Zheng L, Cowels A, Hsiao J, Zismann V, Liu J, Ouyang S, Thibaud-Nissen F, Hamilton J, Childs K. Expressed sequence tags from loblolly pine embryos reveal similarities with angiosperm embryogenesis. Plant Mol Biol. 2006;62(4–5):485–501. - PubMed
Publication types
MeSH terms
Substances
LinkOut - more resources
Full Text Sources
Other Literature Sources
