. 2013 Apr 15;23(4):527-40.
doi: 10.1016/j.ccr.2013.03.009.

The pivotal role of IKKα in the development of spontaneous lung squamous cell carcinomas

Affiliations

The pivotal role of IKKα in the development of spontaneous lung squamous cell carcinomas

Zuoxiang Xiao et al. Cancer Cell. .

Abstract

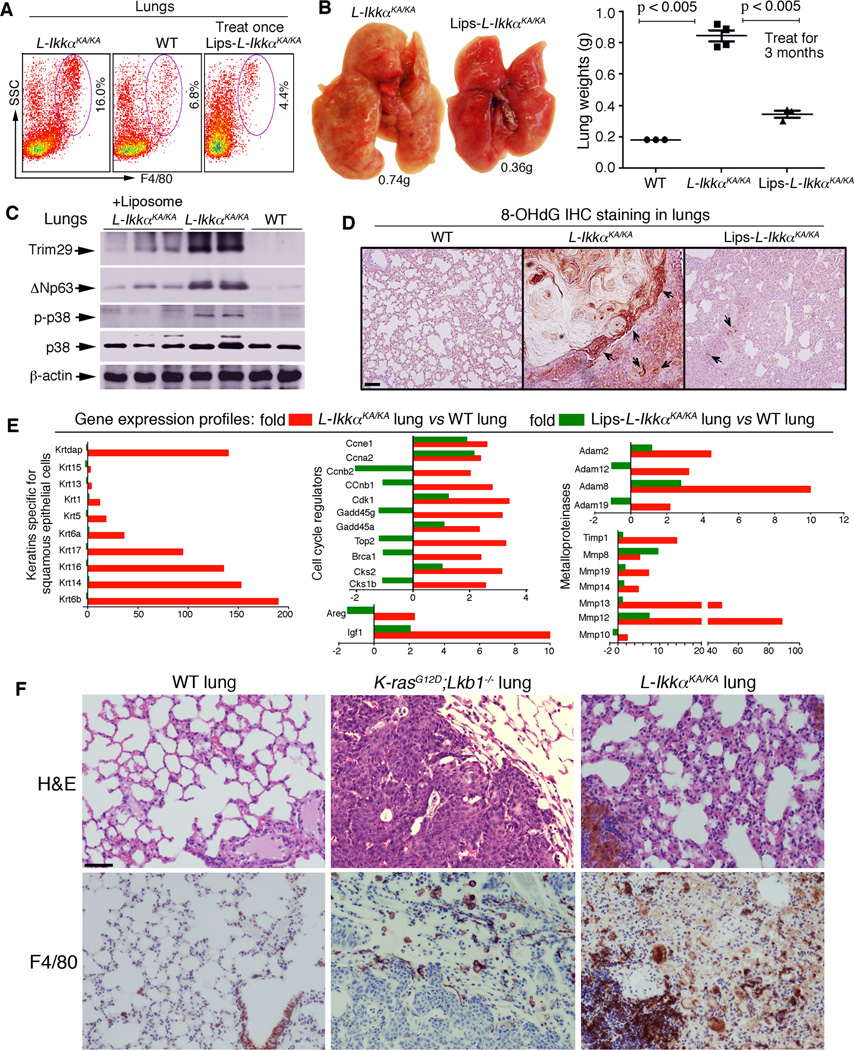
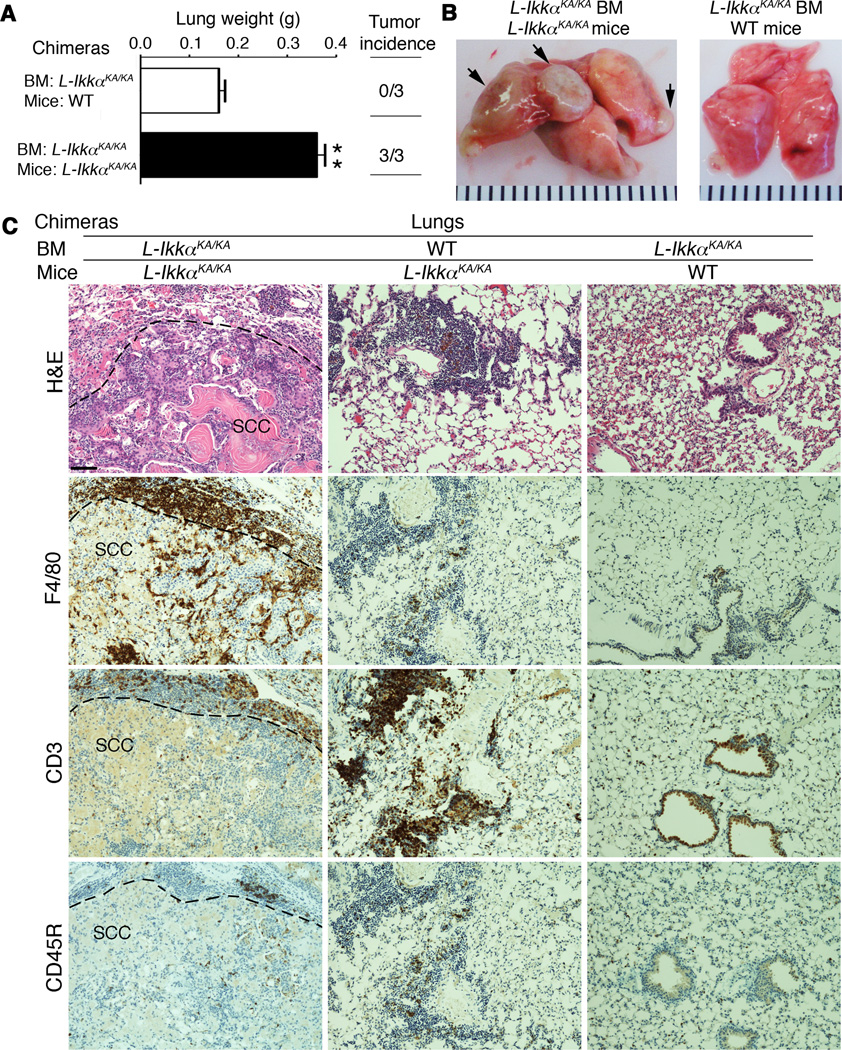
Here, we report that kinase-dead IKKα knockin mice develop spontaneous lung squamous cell carcinomas (SCCs) associated with IKKα downregulation and marked pulmonary inflammation. IKKα reduction upregulated the expression of p63, Trim29, and keratin 5 (K5), which serve as diagnostic markers for human lung SCCs. IKKα(low)K5(+)p63(hi) cell expansion and SCC formation were accompanied by inflammation-associated deregulation of oncogenes, tumor suppressors, and stem cell regulators. Reintroducing transgenic K5.IKKα, depleting macrophages, and reconstituting irradiated mutant animals with wild-type bone marrow (BM) prevented SCC development, suggesting that BM-derived IKKα mutant macrophages promote the transition of IKKα(low)K5(+)p63(hi) cells to tumor cells. This mouse model resembles human lung SCCs, sheds light on the mechanisms underlying lung malignancy development, and identifies targets for therapy of lung SCCs.


Figures

Figure 1
Figure 1. Identification of Lung SCCs in IkkαKA/KA Mice
(A) The lysine (K) at 44 is replaced by alanine (A) within the IKKα kinase domain in IkkαKA/KA mice. (B) Western blot shows IKKα levels in WT and IkkαKA/KA lungs. NB, newborn; β-actin, protein-loading control. (C) Lung SCC incidence in IkkαKA/KA, Lori.IKKα;IkkαKA/KA (L-IkkαKA/KA), and K5.IKKα;IkkαKA/KA (K-IkkαKA/KA) mice with FVB background. n, mouse numbers. (D) WT and L-IkkαKA/KA lung weights (mean ±SD of three mice per group). NB, new born; g, gram. Statistical analysis: *, p < 0.05; **, p < 0.01; ***, p < 0.001 (Student’s test). (E) The histology of hematoxylin and eosin (H&E)–stained WT lungs and SCCs derived from L-IkkαKA/KA lungs. Arrows indicate SCC foci. Scale bar, 50 µm. (F) Immunohistochemically (IHC) stained keratin 5 (K5), p63, and Ki67 in paraffin sections of WT lungs and L-IkkαKA/KA lung SCCs. Brown, positive staining; blue, nuclear countering staining. Scale bar, 50 µm. (G) H&E-stained and K5-, p63-, and Ki67-IHC-stained mouse lung adenocarcinoma (ADC), induced by K-rasG12D. Brown, positive staining; blue, nuclear countering staining. Scale bar, 50 µm. (H) H&E-stained forestomach paraffin sections of WT, K-IkkαKA/KA, and IkkαKA/KA (with SCC in situ and see also Figures S1F) mice at 1.2 years of age. AH, atypical hyperplasia. Scale bar, 50 µm. See also Figure S1.
Figure 2
Figure 2. Molecular Alterations in L-IkkαKA/KA Lungs and Lung SCCs
(A) Western blot shows indicated protein levels in WT lungs, L-IkkαKA/KA lung SCCs, and SCC-adjacent lung tissues (L-IkkαKA/KA lungs). β-actin, protein-loading control. (B) qPCR shows the expression levels (fold) of indicated genes (mean ±SD of three or four mice per group). Each column represents an individual sample that was tested three times. WT and L-IkkαKA/KA lungs were obtained from 9–10-week-old mice. *, p < 0.05; **, p < 0.01; ***, p < 0.001 (Student’s test); N.S., not statistically significant. (C) Western blot shows Trim29 and ΔNp63 levels in WT and L-IkkαKA/KA lungs and lung SCCs. β-actin, protein-loading control. (D) Western blot shows nuclear and cytoplasmic p65 levels in lung cells (CD45-) isolated from WT and L-IkkαKA/KA mice at 4, 16, and 20 weeks of age. (E) Western blot shows IKKα levels in a WT mouse lung epithelial cell line M2C and a L-IkkαKA/KA lung SCC cell line KALLU. β-actin, protein-loading control. (F) Western blot shows nuclear p65 and p50 levels in M2C and KALLU cells following TNF stimulation (10 ng/ml). H3, histone H3 as nuclear protein loading control; nuclear, nuclear proteins. See also Figure S2, Table S1, and Table S2.
Figure 3
Figure 3. IKKα Regulates Trim29 and p63 Expression in an Epigenetic Manner
(A) Immunofluorescent staining shows K5 (green) and ΔNp63 (red) in WT lungs, L-IkkαKA/KA lungs, and L-IkkαKA/KA lung SCCs. Blue color, DAPI for nuclear staining; arrows, indicating ΔNp63 staining. Scale bar, 50 µm. (B) ChIP assay was performed with indicated antibodies (Ab) and PCR with Trim29 and p63 primers in WT, IkkαKA/KA, Ikkα−/− MEFs, and a cell line KALLU from L-IkkαKA/KA lung SCCs. Mock, IgG as negative controls; +IKKα, reintroducing IKKα into cells; H3, control for ChIP assay. (C) RT-PCR with ΔNp63 and Trim29 primers from indicated cells. +IKKα, reintroducing IKKα into cells. (D) The proliferation of KALLU cells was examined at 2, 24, 48, and 72 hr following transfection with IKKα vector or control vector, using the kit of CellTiter 96® AQueous One Solution Cell Proliferation Assay (Promega) and mean ±SD of four samples per group. (E) IHC staining with an anti-IKKα antibody shows strong nuclear IKKα in the cells of bronchial epithelium of adult WT mice. The area in the box of the middle panel was amplified at the top panel. Brown, positive staining; arrows, bronchial epithelium; blue, nuclear counterstaining; NC, negative control. Scale bar, 50 µm. (F) Western blotting shows IKKα levels in a WT human lung cell line HBEC and a human lung SCC cell line SW-900. β-actin, protein-loading control. (G) Left panel: RT-PCR with ΔNp63 and Trim29 primers from indicated cells. +IKKα, reintroducing IKKα into cells. Right panel: the comparison of mRNA levels of ΔNp63 and Trim29 in HBEC and SW-900 cells (mean ±SD of three samples per group). *, p < 0.05; **, p < 0.01, ***, p < 0.01 (Student’s test). (H) ChIP assay was performed with indicated antibodies (Ab) and PCR with Trim29 and p63 primers in a normal human lung cell line and two human lung SCC cell lines. Mock, IgG as negative controls; +IKKα, reintroducing IKKα into cells; H3, control for ChIP assay.
Figure 4
Figure 4. Marked Inflammation in the Lungs of L-IkkαKA/KA Mice
(A) The comparison of indicated leukocytes in the lungs of WT and L-IkkαKA/KA mice at 4 and 16 weeks of age, examined with flow cytometry analysis (mean ±SD of four samples per group). *, p < 0.05; **, p <0.01; ***, p < 0.001. (B) The expression levels (fold changes) of various cytokines and chemokines in the lungs of L-IkkαKA/KA mice at 4 weeks of age were compared to WT lungs using qPCR. The fold changes were calculated with DDCt methods (mean ±SD of four samples per group). n.s., not statistically significant. (C) Macrophages, lung SCCs, and WT lungs were immunofluorescently stained with anti-F4/80 (red for macrophages) and anti-K5 (green for epithelial cells) antibodies. Blue, DAPI for nuclear staining. Scale bar, 50 µm. (D) The expression of iNOS (red) in macrophages (green) in the lungs of WT and L-IkkαKA/KA mice at 16 weeks of age, detected using immunofluorescent staining. Blue, DAPI for nuclear staining. Scale bar, 50 µm. (E) Comparison of IHC-stained CD68+ cell counts in each tissue of the human array slide (LC991) among 3 groups (mean ±SD of thirty-two tissues per group). p value was examined by Student’s test. (F) One representative case (see E) was shown and the region in the box was amplified in the left panel indicated by lines. Brown, CD68 positive staining; blue, nuclear counterstaining; -L, lung tissue. Scale bar, 50 µm. See also Table S3.
Figure 5
Figure 5. Depletion of Macrophages Prevents Lung SCC Development
(A) Flow cytometry analysis shows the number of macrophages (F4/80) in the lungs of WT, L-IkkαKA/KA, and liposome-treated (Lips-, one treatment) L-IkkαKA/KA mice. (B) Left panel: the lungs (g, gram) of L-IkkαKA/KA mice after 3 months of treatment and untreated L-IkkαKA/KA mice. Right panel: the comparison of the lung weights of treated L-IkkαKA/KA, untreated L-IkkαKA/KA, and WT mice (mean ±SD of three or four mice per group). (C) Trim29, ΔNp63, p38, and p-p38 levels in WT, L-IkkαKA/KA, and Lips-L-IkkαKA/KA lungs, detected using Western blotting. β-actin, protein-loading control. (D) The immunohistochemically (IHC) stained 8-Hydroxydeoxyguanosine (8-OHdG) in WT, L-IkkαKA/KA, and Lips-L-IkkαKA/KA lungs. Brown, positive staining. Scale bar, 50 µm. (E) The comparison of the gene expression profiles (fold) of L-IkkαKA/KA versus (vs) WT (red bars) and Lips-L IkkαKA/KA vs WT lungs (green bars) using microarray. (F) H&E- or F4/80-IHC-stained lungs of WT, K-rasG12D;Lkb1−/−and L-IkkαKA/KA mice. Blue, nuclear countering staining; brown, positive staining. Scale bar, 50 µm. See also Figure S3 and Table S4.
Figure 6
Figure 6. The Effect of BM Cells on Inflammation and SCC Development in the Lungs of Mice
(A) Left panel: the lung weights (g, gram) of irradiated WT and L-IkkαKA/KA chimeras at 16 weeks of age (mean ±SD of three mice per group). Right panel: tumor incidence in indicated irradiated chimeras. **, p <0.01. (B) The appearance of indicated mice at 4 months of age. (C) H&E staining and IHC-CD3, -F4/80, and -CD45R staining in the lungs of indicated irradiated chimera. Brown, positive staining; blue, nuclear counterstaining. Scale bar, 50 µm. See also Figure S4.
Figure 7
Figure 7. A Working Model of Lung SCC Development in LlkkαKA/KA Mice
IKKα downregulation dysregulates the expression of multiple oncogenes and tumor suppressors in K5+ lung epithelial cells. The mutant macrophages increase inflammatory responses and oxidative stress to promote DNA damage in IKKα-mutant K5+ lung epithelial cells, which further dysregulate the levels of multiple oncogenes, tumor suppressors, and stem cell genes, thereby promoting the IKKαlowK5+p63hi cell transition to tumor cells in L-IkkαKA/KA lungs. Arrow down (green), downregulation; arrow up (red), upregulation; crossing two lines, inhibition.

References

    1. Aspenstrom P, Ruusala A, Pacholsky D. Taking Rho GTPases to the next level: the cellular functions of atypical Rho GTPases. Exp. Cell Res. 2007;313:3673–3679. - PubMed
    1. Balkhi MY, Willette-Brown J, Zhu F, Chen Z, Liu S, Guttridge DC, Karin M, Hu Y. IKKalpha-mediated signaling circuitry regulates early B lymphopoiesis during hematopoiesis. Blood. 2012;119:5467–5477. - PMC - PubMed
    1. Bardeesy N, Sinha M, Hezel AF, Signoretti S, Hathaway NA, Sharpless NE, Loda M, Carrasco DR, DePinho RA. Loss of the Lkb1 tumour suppressor provokes intestinal polyposis but resistance to transformation. Nature. 2002;419:162–167. - PubMed
    1. Bernstein BE, Mikkelsen TS, Xie X, Kamal M, Huebert DJ, Cuff J, Fry B, Meissner A, Wernig M, Plath K, et al. A bivalent chromatin structure marks key developmental genes in embryonic stem cells. Cell. 2006;125:315–326. - PubMed
    1. Biswas SK, Mantovani A. Macrophage plasticity and interaction with lymphocyte subsets: cancer as a paradigm. Nat. Immunol. 2010;11:889–896. - PubMed

Publication types

MeSH terms

Associated data