. 2013 Aug;34(8):1756-63.
doi: 10.1093/carcin/bgt129. Epub 2013 Apr 18.

DNA methylation and histone modifications of Wnt genes by genistein during colon cancer development

Affiliations

DNA methylation and histone modifications of Wnt genes by genistein during colon cancer development

Yukun Zhang et al. Carcinogenesis. 2013 Aug.

Abstract

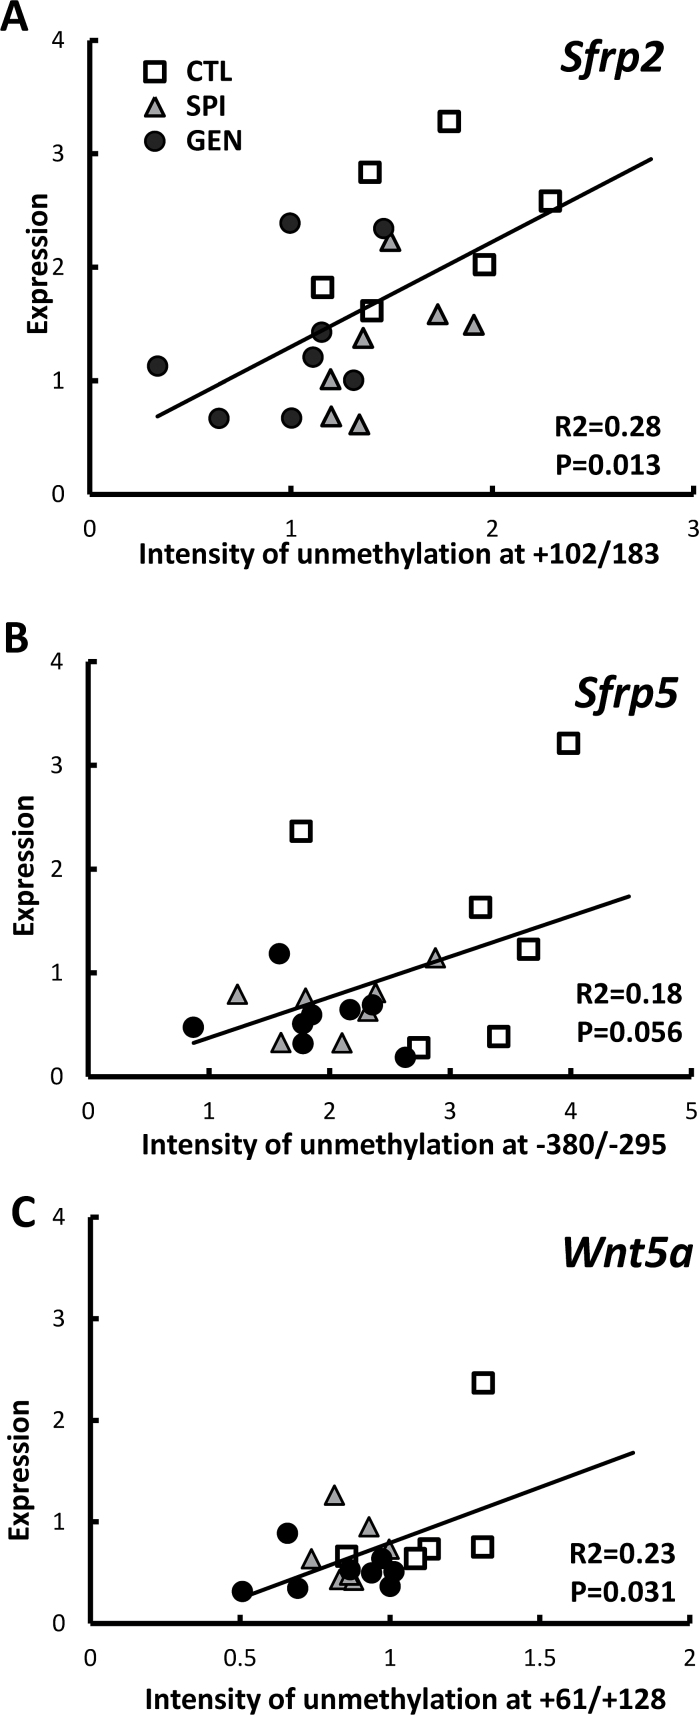
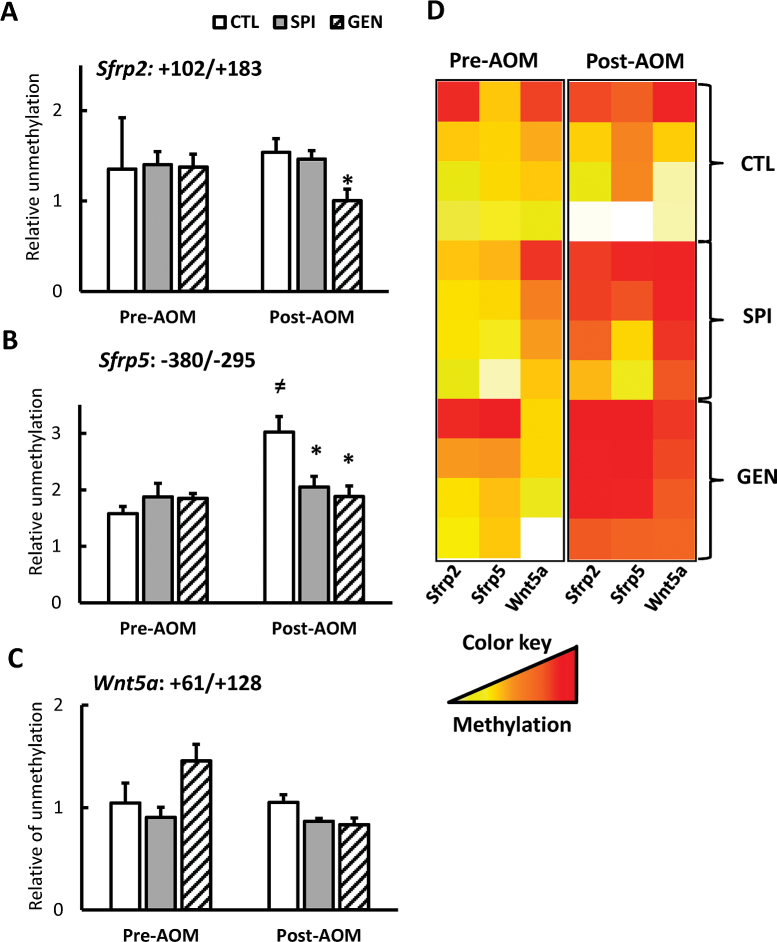
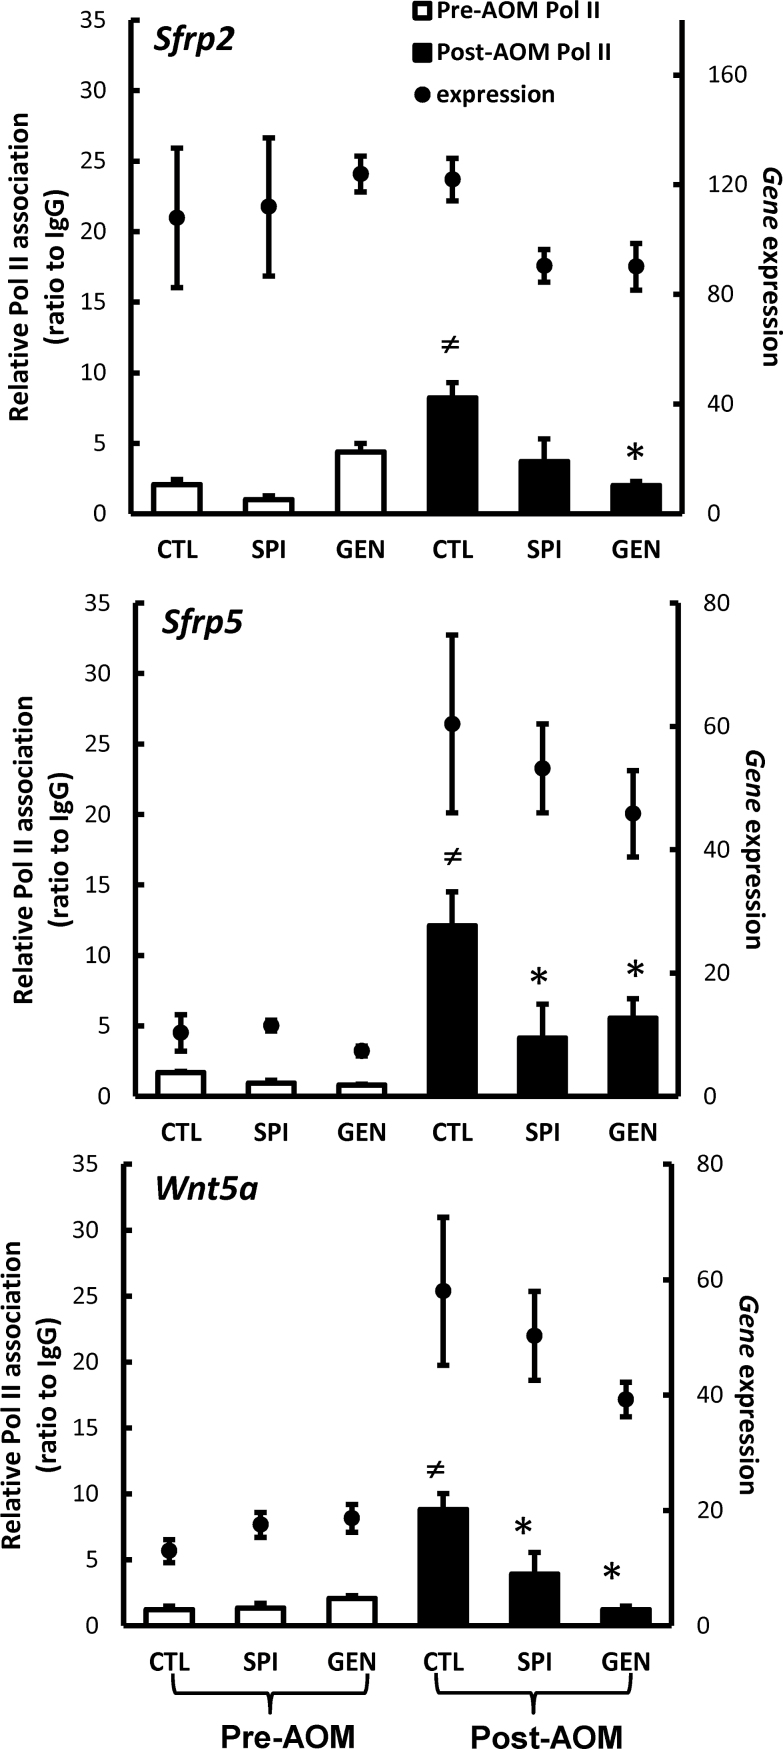
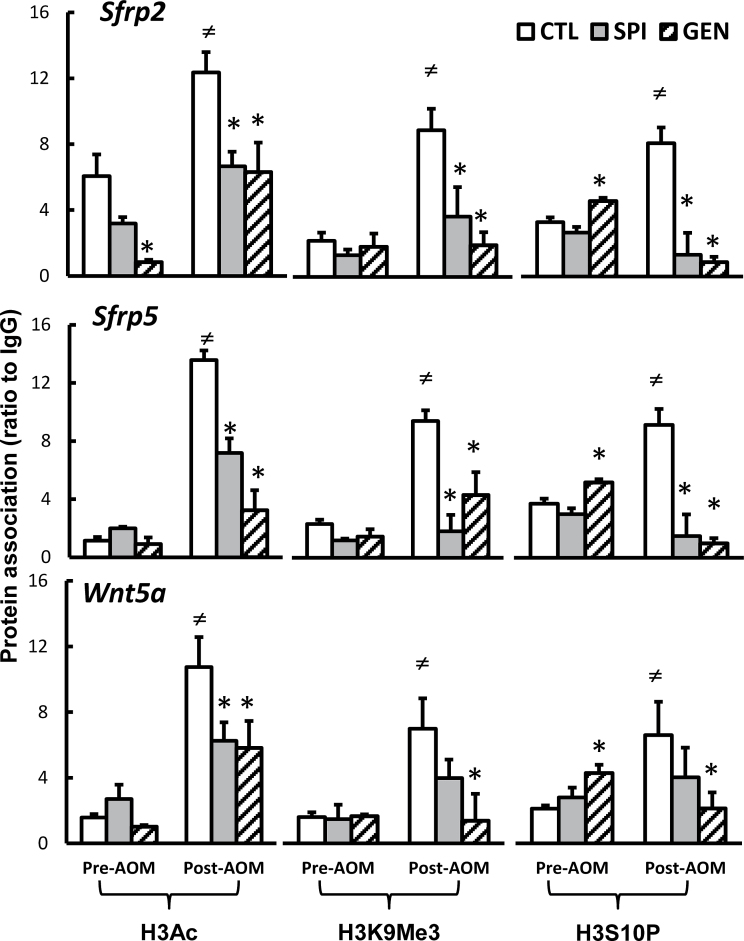
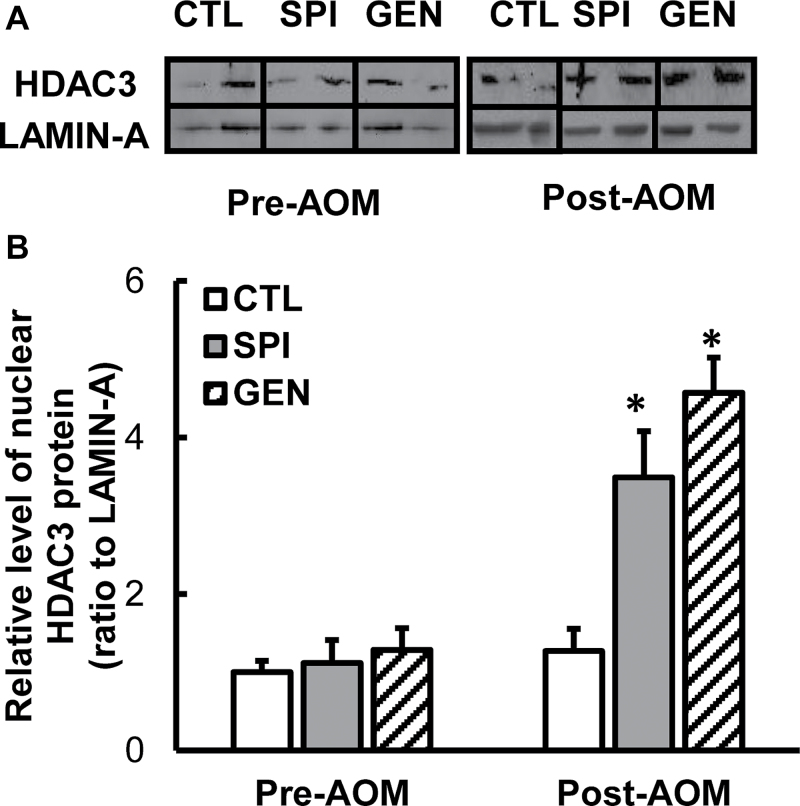
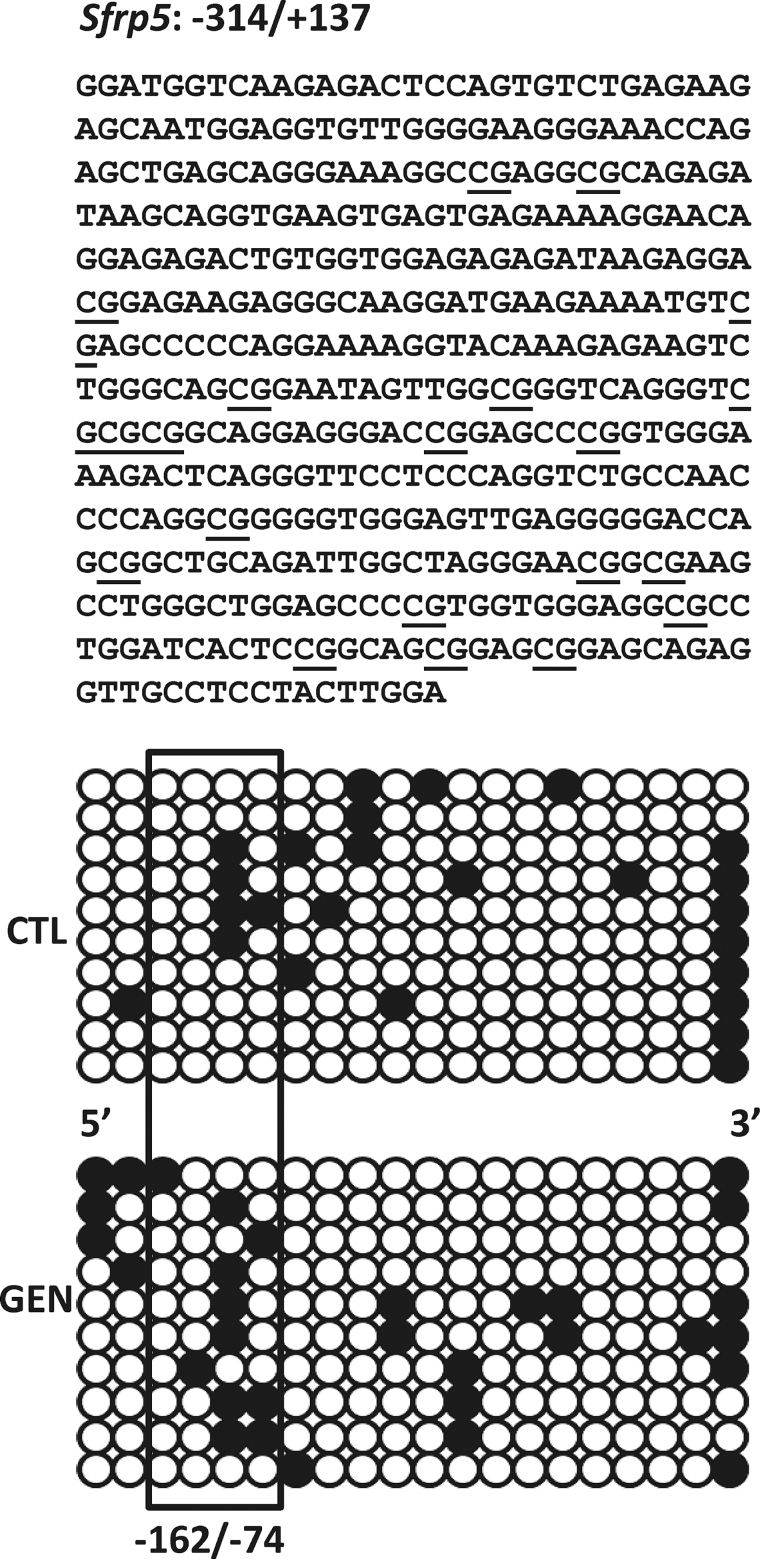
This study aims to elucidate the epigenetic mechanisms by which genistein (GEN) maintains a normal level of WNT genes during colon cancer development. We have reported that soy protein isolate (SPI) and GEN repressed WNT signaling, correlating with the reduction of pre-neoplastic lesions in rat colon. We hypothesized that SPI and GEN induced epigenetic modifications on Sfrp2, Sfrp5 and Wnt5a genes, suppressing their gene expression induced by azoxymethane (AOM), a chemical carcinogen, to the similar level as that of pre-AOM period. We identified that in the post-AOM period, histone H3 acetylation (H3Ac) was downregulated by SPI and GEN at the promoter region of Sfrp2, Sfrp5 and Wnt5a, which paralleled with the reduced binding of RNA polymerase II. Nuclear level of histone deacetylase 3 was enhanced by SPI and GEN. The diets suppressed the trimethylation of histone H3 Lysine 9 (H3K9Me3) and the phosphorylation of histone H3 Serine 10 (H3S10P). Methylation of the specific region of Sfrp2, Sfrp5 and Wnt5a genes was increased by SPI and GEN, which was inversely correlated with the reduction of gene expression. Bisulfite sequencing further confirmed that dietary GEN induced DNA methylation at CpG island of the promoter region of Sfrp5. Importantly, this region includes a fragment that had decreased H3Ac. Here, we present a potential epigenetic mechanism by which dietary GEN controls the responses of WNT genes during carcinogen induction, which involves DNA methylation, histone modifications and their interactions at the regulatory region of gene.


Figures

Fig. 1.
Fig. 1.
Correlation between DNA methylation and gene expression of Sfrp2, Sfrp5 and Wnt5a of rat descending colons in the post-AOM period. Regression analysis was performed to illustrate the correlation between the level of unmethylation and that of expression of Sfrp2 (A), Sfrp5 (B) and Wnt5a (C). Samples were collected from rats fed control (open squares: CTL, n pre-AOM = 6; n post-AOM = 8), SPI (shaded triangles: SPI, n pre-AOM = 8; n post-AOM = 8) and GEN (closed circles: GEN, n pre-AOM = 8; n post-AOM = 8) diets. Gene expression was analyzed by real-time reverse transcription–PCR and the relative quantity was presented.
Fig. 2.
Fig. 2.
Change of DNA methylation of Sfrp2, Sfrp5 and Wnt5a in rat descending colons. Intensity of unmethylation at promoter of each gene was presented (A: Sfrp2, B: Sfrp5 and C: Wnt5a). Samples were collected from rats fed control (CTL, n pre-AOM = 6; n post-AOM = 8), SPI (SPI, n pre-AOM = 8; n post-AOM = 8) and GEN (GEN, n pre-AOM = 8; n post-AOM = 8) diets. Data were shown as ratio of unmethylation intensity of the region of interest to that of the region of control and presented as means ± SEM. *, significant difference compared with CTL in post-AOM, P < 0.05. ≠, mean values of CTL that are significantly different compared with the CTL in pre-AOM, P < 0.05. (D) Heatmap of the intensity of unmethylation at +102/+183 of Sfrp2, −380/−295 of Sfrp5 and +61/+128 of Wnt5a. Samples from four rats in each group were analyzed and presented. Each square represents the methylation level of the gene from an individual rat. The data are scaled to 0 as the mean and ±1 as the standard deviation. Color intensity indicates level of methylation.
Fig. 3.
Fig. 3.
Binding of Pol II at the promoter of Sfrp2, Sfrp5 and Wnt5a of rat descending colons in the pre- and post-AOM period. Samples from four rats in each group were analyzed and presented as the means ± SEM. Bars (open bars, closed bars) are shown as mean ratios of the binding of Pol II to that of IgG and scaled on the primary y-axis (left). Dots represent means ± SEM of gene expression and scaled on the secondary y-axis (right). ≠, mean values of CTL that are significantly different compared with the CTL in pre-AOM, P < 0.05. *, mean values that are significantly different compared with CTL group within the same time period, P < 0.05.
Fig. 4.
Fig. 4.
Histone acetylation, methylation and phosphorylation at the promoter of Sfrp2, Sfrp5 and Wnt5a in rat descending colon. Left panel, H3Ac; middle panel, trimethylated histone H3K9 (H3K9Me3); right panel, phosphorylated histone H3S10 (H3S10P). ChIP was performed using antibodies against the specific histone tail modifications and the raw values were normalized to the negative control IgG. Samples from four rats in each group were analyzed and data were presented as the means ± SEM. *, mean values that are significantly different compared with CTL counterpart within the same time period, P < 0.05. ≠, mean values of CTL that are significantly different compared with the CTL in pre-AOM, P < 0.05.
Fig. 5.
Fig. 5.
Nuclear HDAC3 abundance in rat descending colon. (A) Representative blots of HDAC3 and lamin A from western blot analysis. (B) Quantification of western blot analysis. Lamin A served as the loading control for nuclear extracts. Samples from three rats in each group were analyzed and data were presented as the means ± SEM. *, mean values that are significantly different compared with CTL counterpart within the same time period, P < 0.05.
Fig. 6.
Fig. 6.
DNA methylation at Sfrp5 promoter in rat descending colon after AOM induction. Bisulfite sequencing was performed to detect the change of DNA methylation at the proposed CpG island of Sfrp5 (−314/+137). Each CpG site is underlined in the tested region (top panel). Ten clones from each dietary group were sequenced and presented (bottom panel). Open circles represent unmethylated CpG sites and filled circles represent methylated CpG sites. Each row of circles represents an individual clone used for sequencing. Framed circles indicate the region (−162/−74) that overlaps with ChIP assay.

Similar articles

Cited by

References

    1. Portela A., et al. (2010). Epigenetic modifications and human disease. Nat. Biotechnol., 28, 1057–1068 - PubMed
    1. Esteller M. (2007). Epigenetics provides a new generation of oncogenes and tumour-suppressor genes. Br. J. Cancer, 96 (suppl.), R26–R30 - PubMed
    1. Kim M.S., et al. (2010). DNA methylation markers in colorectal cancer. Cancer Metastasis Rev., 29, 181–206 - PubMed
    1. Konishi K., et al. (2007). Targeting aberrant chromatin structure in colorectal carcinomas. Cancer J., 13, 49–55 - PubMed
    1. Cravo M., et al. (1996). Global DNA hypomethylation occurs in the early stages of intestinal type gastric carcinoma. Gut., 39, 434–438 - PMC - PubMed

Publication types

MeSH terms