. 2013 Apr 15;27(8):900-15.
doi: 10.1101/gad.203984.112. Epub 2013 Apr 18.

Tumor suppressor activity of the ERK/MAPK pathway by promoting selective protein degradation

Affiliations

Tumor suppressor activity of the ERK/MAPK pathway by promoting selective protein degradation

Xavier Deschênes-Simard et al. Genes Dev. .

Abstract

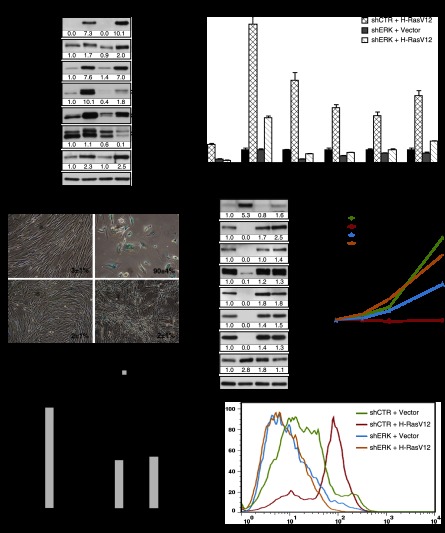
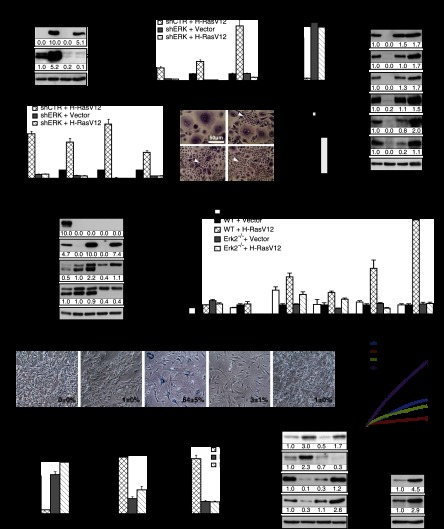
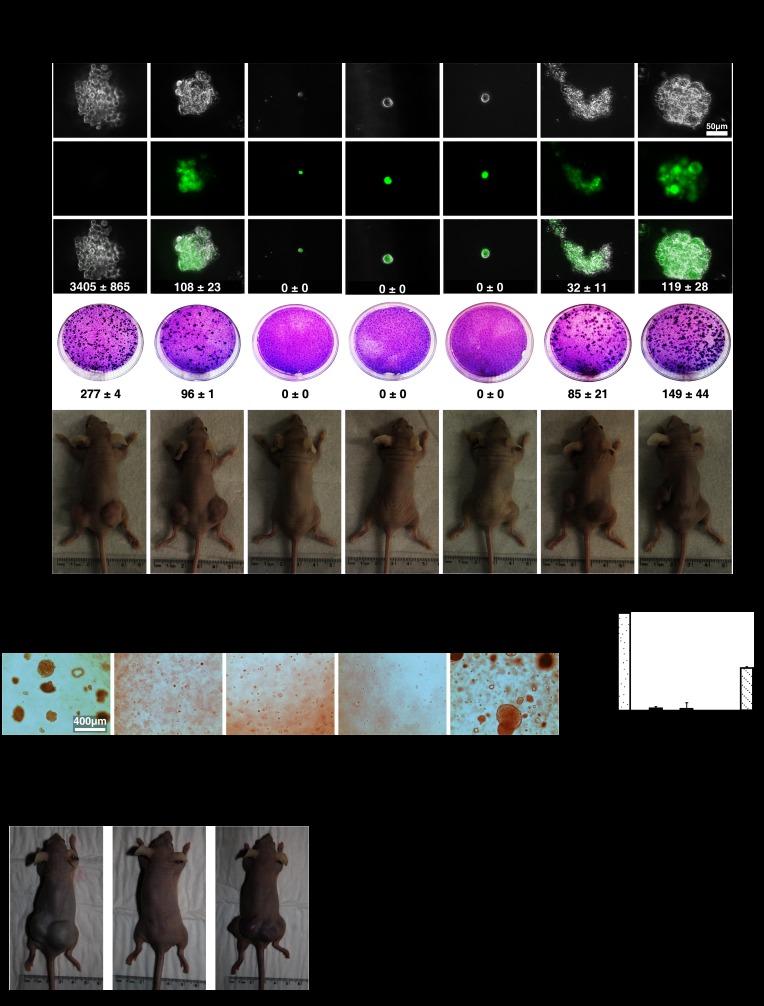
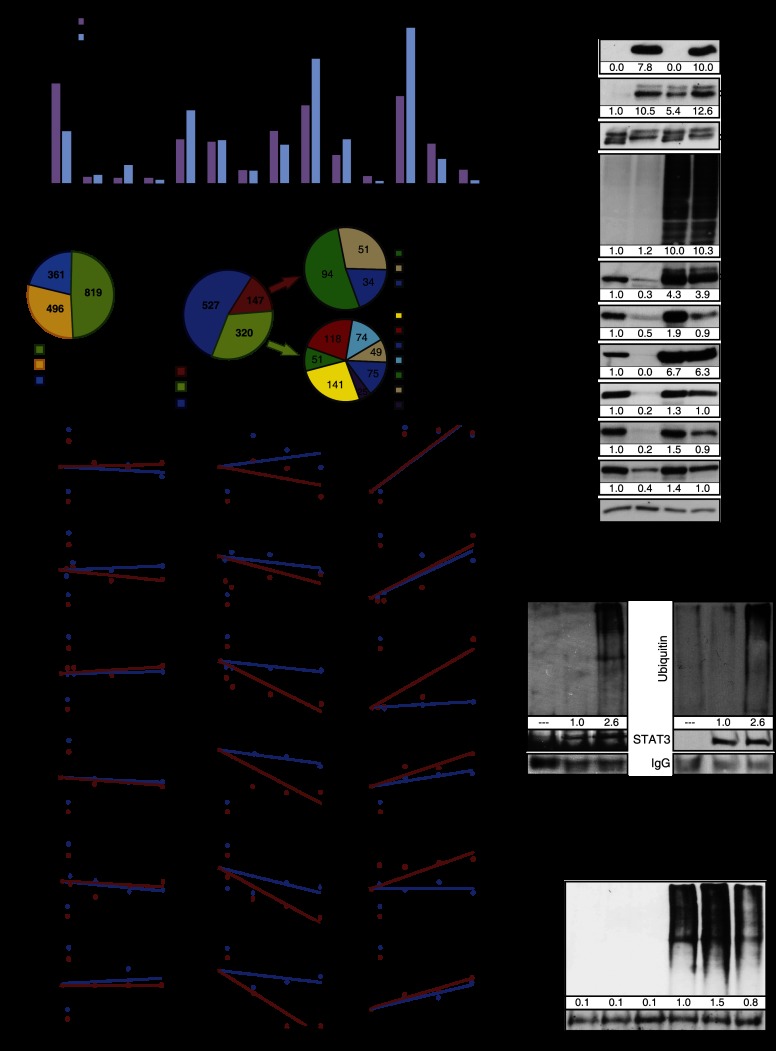
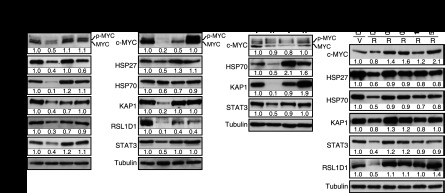
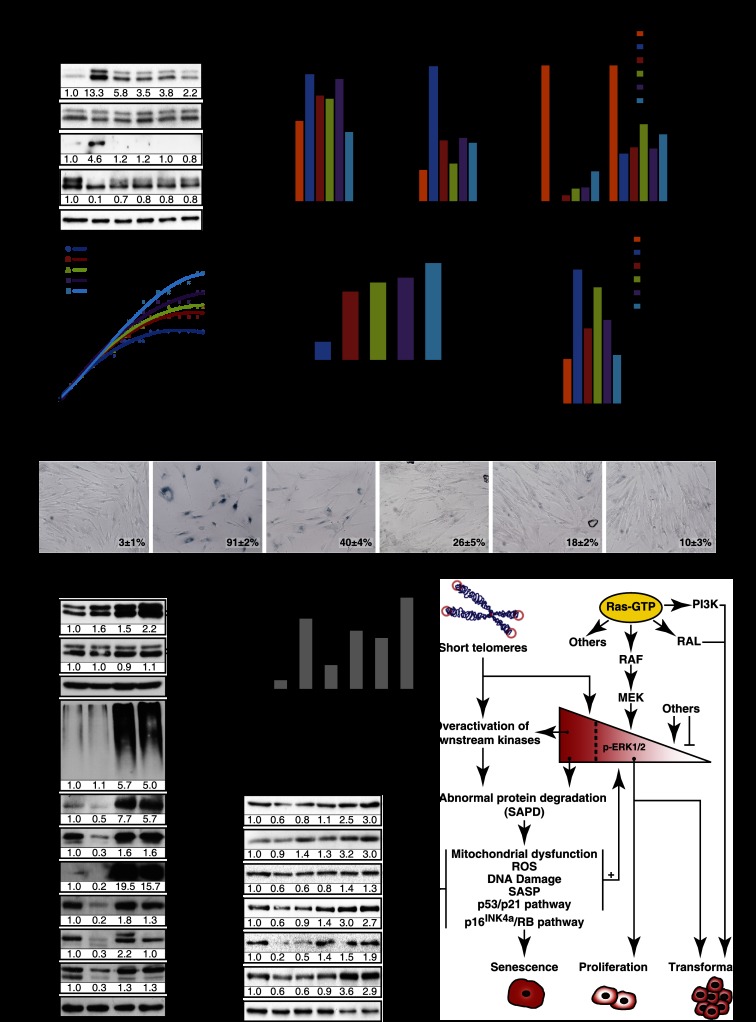
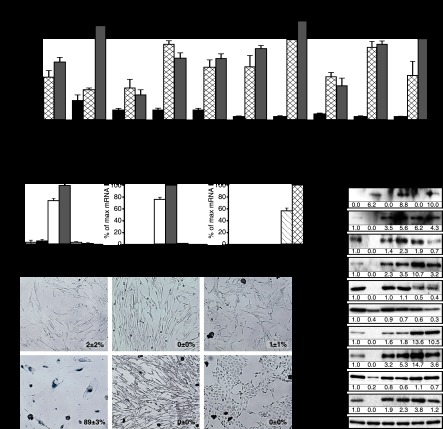
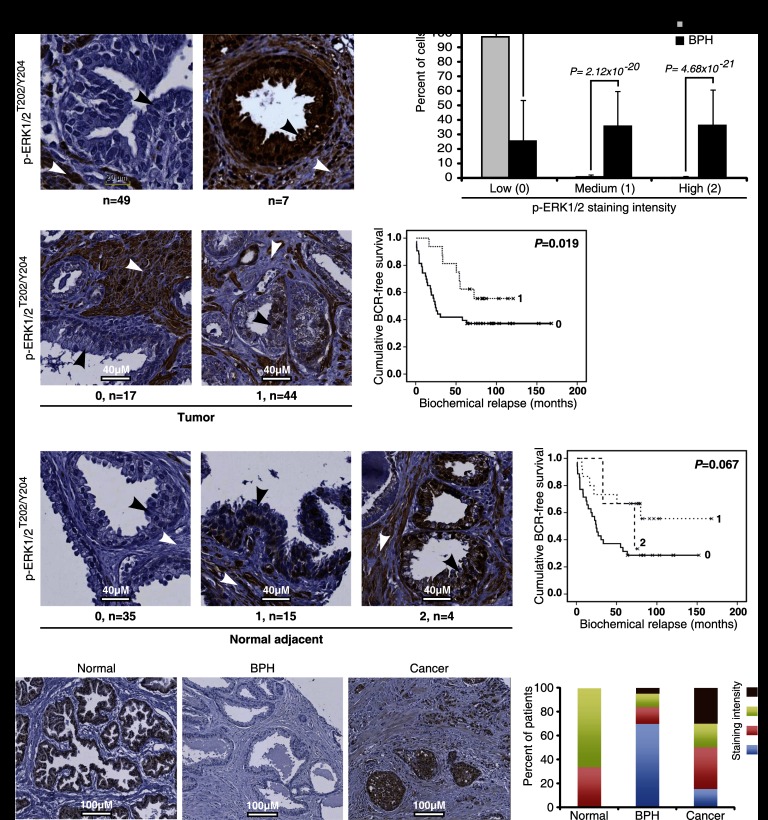
Constitutive activation of growth factor signaling pathways paradoxically triggers a cell cycle arrest known as cellular senescence. In primary cells expressing oncogenic ras, this mechanism effectively prevents cell transformation. Surprisingly, attenuation of ERK/MAP kinase signaling by genetic inactivation of Erk2, RNAi-mediated knockdown of ERK1 or ERK2, or MEK inhibitors prevented the activation of the senescence mechanism, allowing oncogenic ras to transform primary cells. Mechanistically, ERK-mediated senescence involved the proteasome-dependent degradation of proteins required for cell cycle progression, mitochondrial functions, cell migration, RNA metabolism, and cell signaling. This senescence-associated protein degradation (SAPD) was observed not only in cells expressing ectopic ras, but also in cells that senesced due to short telomeres. Individual RNAi-mediated inactivation of SAPD targets was sufficient to restore senescence in cells transformed by oncogenic ras or trigger senescence in normal cells. Conversely, the anti-senescence viral oncoproteins E1A, E6, and E7 prevented SAPD. In human prostate neoplasms, high levels of phosphorylated ERK were found in benign lesions, correlating with other senescence markers and low levels of STAT3, one of the SAPD targets. We thus identified a mechanism that links aberrant activation of growth signaling pathways and short telomeres to protein degradation and cellular senescence.


Figures

Figure 1.
Figure 1.
ERK/MAPK inhibition bypasses Ras-induced senescence. (A) Immunoblots for proteins in the ERK pathway using extracts from fibroblasts expressing H-RasV12 (R) or an empty vector (V) and shRNA against ERK2 (shERK) or a nontargeting shRNA (shCTR) obtained from cells 14 d after infection. (B) Quantitative PCR (qPCR) for ERK2 mRNA and mRNAs encoded by ERK-stimulated genes in cells as in A. (C) SA-β-Gal of cells as in A. Data were quantified from 100 cell counts in triplicate and are presented as the mean percentage of positive cells ± standard deviation (SD). (D) Immunoblots for cell cycle-regulated proteins in cells as in A. (E) Growth curves started with cells as in A. Data are presented as mean ± SD of triplicates. (F) Quantitation of BrdU incorporation (2 h of incubation with 10 μM BrdU) and KI-67 staining in cells as in A. Data were quantified from 100 cell counts in triplicate and are presented as the mean of positive cells ± SD. (***) P < 0.0005, two-sample t-test. (G) Superoxide levels in cells as before, measured by flow cytometry (FACS) after staining with 1 μM fluorescent probe dihydroethidium (DHE) during 1 h. The results are expressed as the percentage of maximum cell number. The maximum cell number is the number of cells for the most-represented fluorescence intensity in the cell population of a condition and is expressed as 100%. All experiments were performed a minimum of three times.
Figure 2.
Figure 2.
ERK/MAP kinases play a general role in cellular senescence. (A–G) Role of ERK/MAPK in H-RasV12-induced senescence in primary HMECs. (A) Immunoblots to confirm ERK knockdown and expression levels of H-RasV12 in extracts obtained 14 d after infection. (B) qPCR for ERK target genes to confirm the biological effect of ERK knockdown in cells expressing the indicated vectors. (C) qPCR for KI-67, a proliferation marker, in cells as in A. (D) Immunoblots for proteins in the RB pathway and mitosis markers in cells as in A. (E) qPCR for senescence markers in cells as in A. (F) Morphology of HMECs expressing H-RasV12-ER and shRNA against ERK2 (shERK) or a nontargeting shRNA (shCTR). Note the large size and vacuolated cytoplasm of senescent cells in contrast with the small growing cells that escape from senescence (arrows) due to low phospho-ERK levels. (G) Quantification of the bypass from senescence between cells with shControl (shCTR) and shERK2. Error bars represent SD. (**) P < 0.005, two-sample t-test. (HP) Genetic inactivation of Erk2 bypasses Ras-induced senescence in MEFs. (H) Immunoblots for the indicated proteins in wild-type and Erk2−/− MEFs expressing H-RasV12, a vector control, or H-RasV12 + E1A 14 d after infection. (I) qPCR for Erk target genes in cells as in H. (J) SA-β-Gal markers in cells as in H. Data were quantified from 100 cell counts in triplicate and are presented as the mean percentage of positive cells ± SD. (K) Growth curves started with MEFs from wild-type and Erk2−/− animals expressing H-RasV12 or a vector control 14 d after infection. Data are presented as the mean ± SD of triplicates. (LN) qPCR for the indicated genes in cells as in H. (O) Immunoblots for the indicated senescence markers in cells as in H. (P) Immunoblots against p53 and p53S15 from Erk2−/− MEFs treated for 24 h with doxorubicin (300 ng/mL) or vehicle. Experiments were performed n ≥ 3.
Figure 3.
Figure 3.
ERK/MAPK inhibition promotes Ras-induced transformation. (A, top) Soft agar assay with HeLa cells or IMR90 fibroblasts expressing the indicated vectors. Representative GFP-positive colonies are shown. A focus-forming assay (middle) and tumor formation in nude mice (bottom) were performed with cells as above. Numbers of colonies in soft agar and focus-forming assays are expressed as the mean ± SD of triplicates. (B) Soft agar assay with wild-type and Erk2−/− MEFs expressing the indicated vectors. (C) Quantification of B using the CyQuant GR dye. (RFU) Relative fluorescence units (a measure of growth in soft agar). Data are presented as mean ± SD of triplicates. (D) Tumor formation in nude mice of wild-type (WT) and Erk2−/− MEFs expressing the indicated vectors. (E) Quantification of tumor formation in nude mice. The number of injections that generated tumors and the time taken by the tumors to reach the threshold of significance (0.2 cm3) are shown.
Figure 4.
Figure 4.
Selective and proteasome-dependent protein degradation characterizes Ras-induced senescence. (A) Summary of proteomic data obtained from cell lysates of IMR90 fibroblasts expressing a low level (LR) or high level (HR) of oncogenic ras. Cells were harvested 14 d after infection. Data show phosphorylation levels of 14 ERK targets measured by Western blot with phospho-specific antibodies by Kinexus (n = 1). The difference in the relative protein amount in cells that express HR is presented as a percentage of the relative protein amount in LR-expressing cells set as a reference (control). (B) Frequencies of phosphorylation motifs in phosphopeptides stabilized by MG132. Ras senescent cells (10 d after infection with H-RasV12) were treated for 18 h with DMSO (control) or 20 μM MG132. Then, cells were harvested, and protein extracts were analyzed by liquid chromatography-tandem mass spectrometry (LC-MS/MS) for phosphoproteomics (n = 2, in triplicate each time). Phosphopeptides enriched in cells treated with MG132 were analyzed with the Motif-X software tool. Three motif families were identified (acidic, basic, and proline-directed), and almost half the phosphopeptides with an enriched motif have a proline-directed motif. (C) FatiGO single-enrichment analysis of phosphopeptides enriched in Ras-senescent cells treated MG132 with the Babelomics 4.3 platform. This platform was used to identify gene ontology (GO), Kyoto Encyclopedia of Genes and Genomes (KEGG), and Reactome terms that were significantly enriched (Supplemental Fig. S5B). Then, these terms and their associated peptides were grouped in the indicated general categories. These categories were also classified according to their predicted ability to induce senescence or limit transformation when they are decreased. (D) Immunoblots for the indicated proteins and total ubiquitinylated proteins from fibroblasts expressing oncogenic ras or an empty vector (10 d after infection) and treated for 18 h with 20 μM MG132 or DMSO as control (n = 3). (E) Protein stability assays for the indicated proteins in cells as in D. Cells were treated with DMSO, 10 μg/mL cycloheximide, or 20 μM MG132 for the indicated times. The relative protein quantity was evaluated by immunoblotting and quantification with Adobe Photoshop CS4 or Image Lab 4.0 (n ≥ 2). (F,G) Immunoprecipitation of HSP70 or STAT3 in extracts from IMR90 cells expressing H-RasV12 or an empty vector 10 d after infection and treated for 18 h with 20 μM MG132 and immunoblotted against mono- and polyubiquitinylated conjugates (n ≥ 2). (H) Immunoprecipitation of c-MYC in extracts from cells expressing H-RasV12 or an empty vector (10 d after infection) and treated for 18 h with 20 μM MG132 and/or GSK3 inhibitor CHIR99021 (3 μM) and immunoblotted against mono- and polyubiquitinylated conjugates.
Figure 5.
Figure 5.
Role of ERK kinases in SAPD. (A) Immunoblots showing the levels of indicated proteins in IMR90 cells expressing H-RasV12 (R) or a vector control (V) and shERK2 or a control shRNA (shCTR) 14 d after infection (n ≥ 3). (B) Immunoblots for proteins and conditions as in A but for HMECs (n = 3). (C) Immunoblots showing the levels of the indicated proteins in wild-type or Erk2−/− MEFs expressing oncogenic ras or a vector control 14 d after infection (n = 3). (D) Immunoblots for the indicated proteins in IMR90 cells with a vector control (V) or H-RasV12 (R) and treated with the indicated chemicals. The treatments started immediately after infection, and the medium was changed every 2 d. Cells were harvested 10 d after infection (n = 2).
Figure 6.
Figure 6.
ERK and the SAPD during replicative senescence. (A) Immunoblots for the indicated proteins in young (population doublings [PDL] = 21.5) and old (PDL ≥ 40) IMR90 cells treated with the indicated concentrations of MEK inhibitors or DMSO as control for 27 d. Fresh medium and inhibitors were added every 2 d. (BD) qPCR for mRNAs encoded by ERK-stimulated genes and proliferation markers in cells as in A. (E) PDL of normal human fibroblasts in the presence of the indicated concentrations of MEK inhibitors or vehicle during 80 d. The experiment was started with 1 × 10⁶ middle-age (PDL = 34) IMR90 cells for each condition. (F) Relative growth of late-passage human fibroblasts (PLD ≥ 41) after 60 d of treatments with MEK inhibitors or vehicle evaluated by a crystal violet assay. (G) qPCR for IL6 in cells as in A. (H) SA-β-Gal of cells as before after 40 d of treatments. Data were quantified from 100 cell counts in triplicate and are presented as the mean percentage of positive cells ± SD (shown in the bottom right of every panel). (I) Immunoblots for the indicated proteins in young (Y) (PDL = 21.5) and old (O) (PDL = 40) IMR90 cells treated with 20 μM MG132 or vehicle (n = 2). (J) Relative decrease of half-lives for the indicated proteins calculated from cycloheximide stability assays as presented in Figure 4E. (K) Immunoblots for the indicated proteins in cells as in A. (L) High-strength ERK signals or short telomeres lead to protein degradation, which in turn activates multiple stress responses that characterize cellular senescence. Note that the process could be self-sustained by multiple positive feedback loops. Lower levels of ERK signaling are permissive for Ras-dependent transformation in cooperation with other signals stimulated by oncogenic ras.
Figure 7.
Figure 7.
Inactivation and stabilization of targets of SAPD (A) SA-β-Gal of wild-type IMR90 cells or transformed IMR90 cells (hTERT, H-RasV12, and shERK2) expressing the indicated shRNA expression vectors fixed 10 d after infection. Data were quantified from 100 cell counts in triplicate and are presented as the mean percentage of positive cells ± SD. These experiments were done in triplicate and at least two times. (BD) qPCR for the viral oncoproteins E6, E7, and E1A expressed from retroviral vectors in IMR90 cells. (E) SA-β-Gal of IMR90 fibroblasts expressing an empty vector, the human papillomavirus E6/E7 oncoproteins, or the adenovirus E1A oncoproteins together with H-RasV12 or an empty vector. SA-β-Gal activity was measured 14 d after infection. Data were quantified from 100 cell counts in triplicate and are presented as the mean percentage of positive cells ± SD. (F) Immunoblots for cell cycle-regulated proteins and SAPD targets using extracts from cells as in E.
Figure 8.
Figure 8.
Phospho-ERK and STAT3 in the normal prostate and BPH. (A) Phospho-ERK staining in samples from patients with BPH or normal controls. White arrows point to the stroma, and black arrows point to epithelial cells. (B) Quantification of phospho-ERK data in normal and BPH patients according to three degrees of staining intensity (none, 0; moderate, 1; and high, 2). The differences between normal tissues and BPH were evaluated with the nonparametric Mann-Whitney U-test. (C) Degrees of phospho-ERK staining (0, 1, and 2) in prostate cancer. The survival Kaplan-Meier curves describe the time for biochemical relapse (BCR) in patients with different levels of staining. (D) Degrees of phospho-ERK staining (0, 1, and 2) in normal tissue adjacent to prostate cancer and survival Kaplan-Meier curves as in C. (E) STAT3 staining in samples from patients with BPH (n = 43) or normal controls (n = 3) or cancer patients (n = 20). The percentage of patients with a STAT3 staining of four different degrees of intensity (none, 0; low, 1; moderate, 2; and high, 3) is shown in the right panel. The differences between normal and tumor tissues versus BPH were evaluated with the nonparametric Mann-Whitney U-test, P = 0.0003.

References

    1. Bartkova J, Rezaei N, Liontos M, Karakaidos P, Kletsas D, Issaeva N, Vassiliou LV, Kolettas E, Niforou K, Zoumpourlis VC, et al. 2006. Oncogene-induced senescence is part of the tumorigenesis barrier imposed by DNA damage checkpoints. Nature 444: 633–637 - PubMed
    1. Bostwick DG 1996. Prospective origins of prostate carcinoma. Prostatic intraepithelial neoplasia and atypical adenomatous hyperplasia. Cancer 78: 330–336 - PubMed
    1. Bostwick DG, Cooner WH, Denis L, Jones GW, Scardino PT, Murphy GP 1992. The association of benign prostatic hyperplasia and cancer of the prostate. Cancer 70: 291–301 - PubMed
    1. Braig M, Lee S, Loddenkemper C, Rudolph C, Peters AH, Schlegelberger B, Stein H, Dorken B, Jenuwein T, Schmitt CA 2005. Oncogene-induced senescence as an initial barrier in lymphoma development. Nature 436: 660–665 - PubMed
    1. Bric A, Miething C, Bialucha CU, Scuoppo C, Zender L, Krasnitz A, Xuan Z, Zuber J, Wigler M, Hicks J, et al. 2009. Functional identification of tumor-suppressor genes through an in vivo RNA interference screen in a mouse lymphoma model. Cancer Cell 16: 324–335 - PMC - PubMed

Publication types

MeSH terms

Substances