An HMM-based algorithm for evaluating rates of receptor-ligand binding kinetics from thermal fluctuation data
- PMID: 23599504
- PMCID: PMC3673216
- DOI: 10.1093/bioinformatics/btt180
An HMM-based algorithm for evaluating rates of receptor-ligand binding kinetics from thermal fluctuation data
Abstract
Motivation: Abrupt reduction/resumption of thermal fluctuations of a force probe has been used to identify association/dissociation events of protein-ligand bonds. We show that off-rate of molecular dissociation can be estimated by the analysis of the bond lifetime, while the on-rate of molecular association can be estimated by the analysis of the waiting time between two neighboring bond events. However, the analysis relies heavily on subjective judgments and is time-consuming. To automate the process of mapping out bond events from thermal fluctuation data, we develop a hidden Markov model (HMM)-based method.
Results: The HMM method represents the bond state by a hidden variable with two values: bound and unbound. The bond association/dissociation is visualized and pinpointed. We apply the method to analyze a key receptor-ligand interaction in the early stage of hemostasis and thrombosis: the von Willebrand factor (VWF) binding to platelet glycoprotein Ibα (GPIbα). The numbers of bond lifetime and waiting time events estimated by the HMM are much more than those estimated by a descriptive statistical method from the same set of raw data. The kinetic parameters estimated by the HMM are in excellent agreement with those by a descriptive statistical analysis, but have much smaller errors for both wild-type and two mutant VWF-A1 domains. Thus, the computerized analysis allows us to speed up the analysis and improve the quality of estimates of receptor-ligand binding kinetics.
Figures


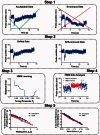
 = mrmlAckon estimated by the two methods. The variations in these values are shown by the 95% confidence interval of the best-fit (dotted lines). The red dotted lines are obscured because they overlap with the red solid line. (B). Comparison of effective on-rate Ackon estimated by descriptive statistical and HMM methods for WT, G1324S (Type 2M) and R1450E (Type 2B) A1s versus GC. Ackon was calculated by dividing
  by the product of the protein densities on the probe (ml for A1) and target (mr for GC) beads, i.e. mrml = 1.96, 2.8 and 0.19 × 105 µm−4 determined by flow cytometry for respective conditions. The error bars indicate the 95% confidence interval for each method

 (A) and off-rates koff (B) for 2D binding kinetics of GPIbα–VWF-A1 interaction under the following biological conditions: the WT VWF-A1 (circles), the LOF VWF-A1 mutant G1324S (squares) and the GOF VWF-A1 mutant R1450E (triangles). The errors were plotted for both the descriptive statistical method (blue) and the HMM method (red). (C and D) The numbers of waiting times (C) and bond lifetimes (D) that the descriptive statistical method (blue) and the HMM method (red) are respectively capable of measuring from the same set of raw data

Similar articles
-
The N-terminal flanking region of the A1 domain regulates the force-dependent binding of von Willebrand factor to platelet glycoprotein Ibα.J Biol Chem. 2013 Nov 8;288(45):32289-32301. doi: 10.1074/jbc.M113.504001. Epub 2013 Sep 23. J Biol Chem. 2013. PMID: 24062306 Free PMC article. Clinical Trial.
-
Kinetics of GPIbalpha-vWF-A1 tether bond under flow: effect of GPIbalpha mutations on the association and dissociation rates.Biophys J. 2003 Dec;85(6):4099-109. doi: 10.1016/S0006-3495(03)74822-X. Biophys J. 2003. PMID: 14645097 Free PMC article.
-
Transport regulation of two-dimensional receptor-ligand association.Biophys J. 2015 Apr 7;108(7):1773-1784. doi: 10.1016/j.bpj.2015.02.023. Biophys J. 2015. PMID: 25863068 Free PMC article.
-
A biophysical view on von Willebrand factor activation.J Cell Physiol. 2018 Feb;233(2):799-810. doi: 10.1002/jcp.25887. Epub 2017 May 16. J Cell Physiol. 2018. PMID: 28256724 Review.
-
Structural determinants within platelet glycoprotein Ibalpha involved in its binding to von Willebrand factor.Platelets. 2000 Nov;11(7):373-8. doi: 10.1080/09537100020019157. Platelets. 2000. PMID: 11132103 Review.
References
-
- Baum LE, et al. A maximization technique occurring in the statistical analysis of probabilistic functions of Markov chains. Ann. Math. Statist. 1970;41:164–171.
-
- Berndt MC, et al. Ristocetin-dependent reconstitution of binding of von Willebrand factor to purified human platelet membrane glycoprotein Ib-IX complex. Biochemistry. 1988;27:633–640. - PubMed
-
- Cardon LR, Stormo GD. Expectation maximization algorithm for identifying protein-binding sites with variable lengths from unaligned DNA fragments. J. Mol. Biol. 1992;223:159–170. - PubMed
-
- Celeux G, Durand J-B. Selecting hidden Markov model state number with cross-validated likelihood. Computation Stat. 2008;23:541–564.
Publication types
MeSH terms
Substances
Grants and funding
LinkOut - more resources
Full Text Sources
Other Literature Sources
Miscellaneous

