. 2012 Feb 1;41B(1):13-21.
doi: 10.1002/cmr.b.21204.

Conductivity and permittivity imaging at 3.0T

Affiliations

Conductivity and permittivity imaging at 3.0T

S B Bulumulla et al. Concepts Magn Reson Part B Magn Reson Eng. .

Abstract

Tissue conductivity and permittivity are critical to understanding local radio frequency (RF) power deposition during magnetic resonance imaging (MRI). These electrical properties are also important in treatment planning of RF thermotherapy methods (e.g. RF hyperthermia). The electrical properties may also have diagnostic value as malignant tissues have been reported to have higher conductivity and higher relative permittivity than surrounding healthy tissue. In this study, we consider imaging conductivity and permittivity using MRI transmit field maps (B1+ maps) at 3.0 Tesla. We formulate efficient methods to calculate conductivity and relative permittivity from 2-dimensional B1+ data and validate the methods with simulated B1+ maps, generated at 128 MHz. Next we use the recently introduced Bloch-Siegert shift B1+ mapping method to acquire B1+ maps at 3.0 Tesla and demonstrate conductivity and relative permittivity images that successfully identify contrast in electrical properties.

Keywords: Hyperthermia; Magnetic resonance imaging; Oncology; Tissue conductivity; Tissue permittivity.


Figures

Figure 1
Figure 1
Human head model in birdcage coil (left), cut-plane view of the central axial plane (right)
Figure 2
Figure 2
Photo of the phantom. The outer compartment and inner compartment can be filled with different fluids
Figure 3
Figure 3
Simulation results: B1+ magnitude (left, μTesla) and phase (right, degrees) at central axial plane
Figure 4
Figure 4
Conductivity image (left, S/m), and relative permittivity image (right) obtained from simulated B1+ data
Figure 5
Figure 5
|B1+| in central axial plane (center) and in axial planes +/− 10mm in S/I directions (right, left, units μTesla). The phantom inner compartment has distilled water and outer compartment has 50% mix of iso-propanol and water
Figure 6
Figure 6
Permittivity image with Laplacian calculated over larger and larger areas (sf=1 (left), sf=2 (center), and sf=3 (right))
Figure 7
Figure 7
Final relative permittivity image (left). The inner compartment has distilled water and the outer compartment has 50% mix of iso-propanol and water. The estimated values on a line that runs across the image, through the inner compartment, is shown on right
Figure 8
Figure 8
|B1+| in central axial plane (center) and in axial planes +/− 12mm in S/I directions (right, left, units μTesla). The phantom inner compartment has a salt solution and outer compartment has 50% mix of iso-propanol and water
Figure 9
Figure 9
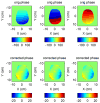
Spin echo phase for the three slices (top, degrees), after removing linear and constant phase terms (bottom, degrees). Note: The color scales are different in top and bottom images.
Figure 10
Figure 10
Conductivity images with Laplacian calculated over larger and larger areas (sf=1 (left), sf=2 (center) and sf=3 (right))
Figure 11
Figure 11
Conductivity image (left, S/m) and the permittivity image (right) for the central axial plane; inner compartment has a salt solution (distilled water with 9g/liter of salt) and outer compartment has 50% mix of iso-propanol and water

References

    1. Wang Z, Lin JC, Mao W, Liu W, Smith MB, Collins CM. SAR and temperature: Simulations and comparison to regulatory limits for MRI. Journal of Magnetic Resonance Imaging. 2007;26(2):437–41. doi: 10.1002/jmri.20977. - DOI - PMC - PubMed
    1. Yeo DTB, Wang Z, Loew W, Vogel MW, Hancu I. Local specific absorption rate in high-pass birdcage and transverse electromagnetic body coils for multiple human body models in clinical landmark positions at 3T. Journal of Magnetic Resonance Imaging. 2011;33(5):1209–17. doi: 10.1002/jmri.22544. - DOI - PMC - PubMed
    1. Das SK, Clegg ST, Samulski TV. Computational techniques for fast hyperthermia temperature optimization. AAPM. 1999:319–28. - PubMed
    1. Fear EC, Hagness SC, Meaney PM, Okoniewski M, Stuchly MA. Enhancing breast tumor detection with near-field imaging. Microwave Magazine, IEEE. 2002;3(1):48–56.
    1. Joines WT, Zhang Y, Li C, Jirtle RL. The measured electrical properties of normal and malignant human tissues from 50 to 900 MHz. Medical physics. 1994;21(4):547–50. - PubMed

LinkOut - more resources