. 2013 Aug;104(8):1097-106.
doi: 10.1111/cas.12181. Epub 2013 May 19.

Adult T-cell leukemia cells are characterized by abnormalities of Helios expression that promote T cell growth

Affiliations

Adult T-cell leukemia cells are characterized by abnormalities of Helios expression that promote T cell growth

Satomi Asanuma et al. Cancer Sci. 2013 Aug.

Abstract

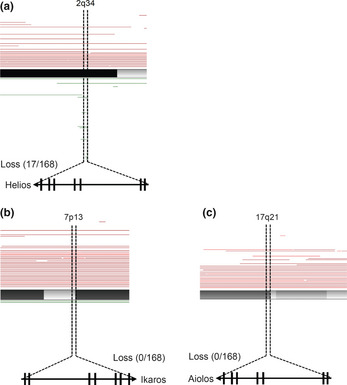
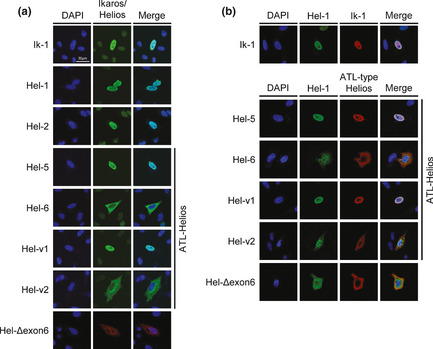
Molecular abnormalities involved in the multistep leukemogenesis of adult T-cell leukemia (ATL) remain to be clarified. Based on our integrated database, we focused on the expression patterns and levels of Ikaros family genes, Ikaros, Helios, and Aiolos, in ATL patients and HTLV-1 carriers. The results revealed profound deregulation of Helios expression, a pivotal regulator in the control of T-cell differentiation and activation. The majority of ATL samples (32/37 cases) showed abnormal splicing of Helios expression, and four cases did not express Helios. In addition, novel genomic loss in Helios locus was observed in 17/168 cases. We identified four ATL-specific short Helios isoforms and revealed their dominant-negative function. Ectopic expression of ATL-type Helios isoform as well as knockdown of normal Helios or Ikaros promoted T-cell growth. Global mRNA profiling and pathway analysis showed activation of several signaling pathways important for lymphocyte proliferation and survival. These data provide new insights into the molecular involvement of Helios function in the leukemogenesis and phenotype of ATL cells, indicating that Helios deregulation is one of the novel molecular hallmarks of ATL.


Figures

Figure 1
Figure 1
(On the next page) Abnormal expression of Helios mRNA in primary adult T‐cell leukemia (ATL) cells. (a) Expression analysis of Ikaros family genes in PBMCs by full‐length RTPCR (Acute, n = 22; Chronic, n = 10; Smoldering, n = 5; HTLV‐1 carriers, n = 5; High‐risk carriers, n = 4). To detect and distinguish alternative splicing variants, PCR analyses were carried out with the sense and antisense primer sets designed in the first and final exons of each full‐length transcript of Ikaros family genes. Obtained cDNAs were cloned and their sequences were analyzed. The samples acute #4, 4', and 4'' were derived from the same patient, but were studied independently. (b) Expression of Ikaros family genes in PBMCs from normal volunteers (n = 10). (c) Schematic representation of Hel‐1, Hel‐2, and ATL‐type Helios isoforms identified in this study. Hel‐variant 1 (Hel‐v1) and Hel‐variant 2 (Hel‐v2) are novel isoforms in ATL. Arrows indicate primer locations of full‐length PCR for Helios. Ex, exon; F1–F6, functional zinc‐finger domains. (d) Nested PCR with specific primer sets, which were designed at exon junction of exon 1–5 or exon 2–5 for detection of Hel‐5 and Hel‐6 (upper panel), or detection of Hel‐v1 (lower panel), respectively. Arrows indicate primer locations.
Figure 2
Figure 2
Genetic abnormalities in Helios locus in primary adult T‐cell leukemia cells. The results of our copy number analyses3 (total number, n = 168; acute type, n = 35; chronic type, n = 41; lymphoma type, n = 44; smoldering type, n = 10; intermediate, n = 1; unknown diagnosis, n = 37). Tumor‐associated deletion of Helios region (17/168) was detected (a). No specific genomic losses were observed in Ikaros (b) or Aiolos loci (c). Recurrent genetic changes are depicted by horizontal lines based on Copy Number Analyser for GeneChip output of the single nucleotide polymorphism array analysis.
Figure 3
Figure 3
Dimerization ability of adult T‐cell leukemia (ATL)‐type Helios isoforms. In vitro dimerization assays by co‐immunoprecipitation between ATL‐type Helios and wild‐type Helios or Ikaros proteins. 293T cells were transfected with the indicated combination of expression vectors and subjected to co‐immunoprecipitation analyses (top panels). Arrowheads indicate the complex of FLAG and HA‐tagged proteins. Middle and bottom panels show the input samples. Hel‐1 (a) and Hel‐ΔC (b) included as positive and negative controls, respectively. ATL‐specific isoforms, Hel‐5 (c), Hel‐6 (d), Hel‐v1 (e), and Hel‐v2 (f) were tested. IB, immunoblot; IP, immunoprecipitant.
Figure 4
Figure 4
Subcellular localization of adult T‐cell leukemia (ATL)‐type Helios isoforms. Immunostaining analyses of Helios and Ikaros proteins. HeLa cells were transfected with each individual expression vector (a) or the indicated combination of expression vectors (b). Each protein was visualized with anti‐FLAG (green) or anti‐HA antibodies (red). Nuclei were detected by DAPI staining (blue). Colocalization between Ik‐1 and ATL‐type Helios was shown in Fig. S2. Hel‐v1, Hel‐variant 1; Hel‐v2, Hel‐variant 2.
Figure 5
Figure 5
Dominant‐negative function of adult T‐cell leukemia (ATL)‐type Helios isoforms. (a) DNA‐binding activities of wild‐type Helios or Ikaros and ATL‐type Helios proteins. Each FLAG‐tagged Helios or Ikaros isoforms were ectopically expressed in 293T cells and their nuclear extracts were subjected to EMSA with a [γ‐32P]‐labeled Hes1 promoter probe. Oct‐1 probe was used as an internal control. Arrowheads indicate Helios or Ikaros complexes. *Non‐specific bands. Hel‐v1, Hel‐variant 1; Hel‐v2, Hel‐variant 2. (b) Results of supershift assays. Anti‐FLAG (0, 0.5, 1 μg) or control IgG (1 μg) antibodies were added to each nuclear extract prior to electrophoresis. The black and white arrowheads indicate the supershifted bands of Ik‐1 and Hel‐1, respectively. (c) Antagonistic effects of Hel‐5 on DNA‐binding of Ik‐1 tested by EMSA. The molar ratios of Ik‐1 to Hel‐5 plasmids are 1:1, 1:4, and 1:8. Expression levels of FLAG‐Ik‐1 and HA‐Hel‐5 were assessed by immunoblotting. The arrowheads indicate the Ik‐1 specific band. AP‐1 probe was used as an internal control. WB, western blot. (d) Transcriptional suppression activities of various Helios or Ikaros isoforms tested by Hes1 promoter‐luciferase reporter systems (n = 3, mean ± SD). Basal Hes1 promoter activity was defined as firefly/renilla ratio, and suppression activities of Helios or Ikaros are relatively presented. Statistical significance was evaluated by unpaired Student's t‐test (*P < 0.05; **P < 0.01). (e) Inhibitory function of Hel‐5 against Ik‐1 and Hel‐1 tested by Hes1 promoter assay (n = 3, mean ± SD). The molar ratios of Ik‐1 or Hel‐1 to Hel‐5 plasmids are 1:1, 1:2, and 1:3. Relative luciferase activities were defined as firefly/renilla ratio.
Figure 6
Figure 6
Hel‐5 functions in T cell growth and survival. (a) Expression patterns and levels of Ikaros family genes in various cell lines examined by RTPCR. ATL, adult T‐cell leukemia; T‐ALL, acute T lymphoblastic leukemia. (b) Results of immunoblotting analyses of the immunoprecipitants (top panel) and cell lysates (lower panels). Positive control (p.c.), Hel‐1 transfectant. IB, immunoblot; IP, immunoprecipitant. (c) Establishment of Jurkat cells stably expressing Hel‐5. The Hel‐5 level was quantified by quantitative RTPCR (top, n = 3, mean ± SD) and immunoblotting (bottom). (d) Cell proliferation analysis of control cells (▲) and Hel‐5‐expressing Jurkat cells (■) under two FCS conditions (n = 3, mean ± SD). Statistical significance was observed (*P <0.01, Student's t‐test). (e) Knockdown analyses of Helios or Ikaros in Jurkat cells. The Helios and Ikaros levels were evaluated by quantitative RTPCR (top, n = 3, mean ± SD) and immunoblotting (bottom), respectively. (f) Cell proliferation curves of scrambled shRNA (shSc) cells (▲), shIkaros (shIk) cells (●), and shHelios (shHel) cells (■) were examined in two FBS conditions (n = 3, mean ± SD; *P < 0.01).
Figure 7
Figure 7
Comprehensive search for Helios target genes by microarray analysis. (a,b) Gene expression analysis of Jurkat stable cells. The gene expression patterns of Jurkat cells expressing Hel‐5 (n = 3), shIkaros (n = 3), and shHelios (n = 3) were comprehensively analyzed by microarray technique. The obtained 2D hierarchical clusters and Pearson's correlation between the cells expressing Hel‐5 or not (a) and the cells introducing shHel, shIk, or shSc (b). (c) Venn diagram of differential gene expression pattern in the Jurkat sublines. The each differential expression gene set (5‐fold changes, < 1 × 10−5) was compared. (d) Venn diagram depicting the overlap between the outputs of pathway analysis in Jurkat sublines. The analysis was based on the NCI‐Nature Pathway Interaction Database.37 Each differential pathway set (t‐test, P < 0.01) was compared and the common pathways listed. (e) Results of quantitative RTPCR of shingosine‐1‐phosphate receptor 1 (S1PR1) and receptor 3 (S1PR3) in Jurkat sublines (n = 3, mean ± SD). HDAC, histone deacetylase; VEGFR, vascular endothelial growth factor receptor.

References

    1. Yamaguchi K, Watanabe T. Human T lymphotropic virus type‐I and adult T‐cell leukemia in Japan. Int J Hematol 2002; 76: 240–45. - PubMed
    1. Iwanaga M, Watanabe T, Utsunomiya A et al Human T‐cell leukemia virus type I (HTLV‐1) proviral load and disease progression in asymptomatic HTLV‐1 carriers: a nationwide prospective study in Japan. Blood 2010; 116: 1211–19. - PubMed
    1. Yamagishi M, Nakano K, Miyake A et al Polycomb‐mediated loss of miR‐31 activates NIK‐dependent NF‐κB pathway in adult T cell leukemia and other cancers. Cancer Cell 2012; 21: 121–35. - PubMed
    1. Yamagishi M, Watanabe T. Molecular hallmarks of adult T cell leukemia. Front Microbiol 2012; 3: 334. - PMC - PubMed
    1. Lo K, Landau NR, Smale ST. LyF‐1, a transcriptional regulator that interacts with a novel class of promoters for lymphocyte‐specific genes. Mol Cell Biol 1991; 11: 5229–43. - PMC - PubMed

Publication types

MeSH terms