Fast presurgical functional mapping using task-related intracranial high gamma activity
- PMID: 23600935
- PMCID: PMC3746067
- DOI: 10.3171/2013.2.JNS12843
Fast presurgical functional mapping using task-related intracranial high gamma activity
Abstract
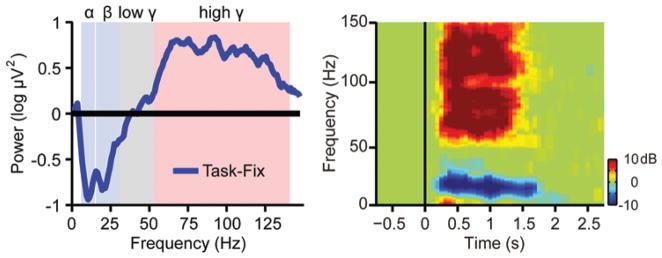
Object: Electrocorticography (ECoG) is a powerful tool for presurgical functional mapping. Power increase in the high gamma band has been observed from ECoG electrodes on the surface of the sensory motor cortex during the execution of body movements. In this study the authors aim to validate the clinical usage of high gamma activity in presurgical mapping by comparing ECoG mapping with traditional direct electrical cortical stimulation (ECS) and functional MRI (fMRI) mapping.
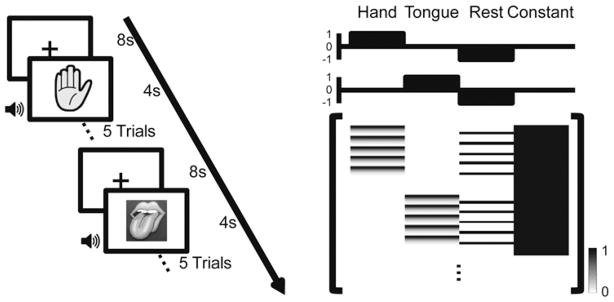
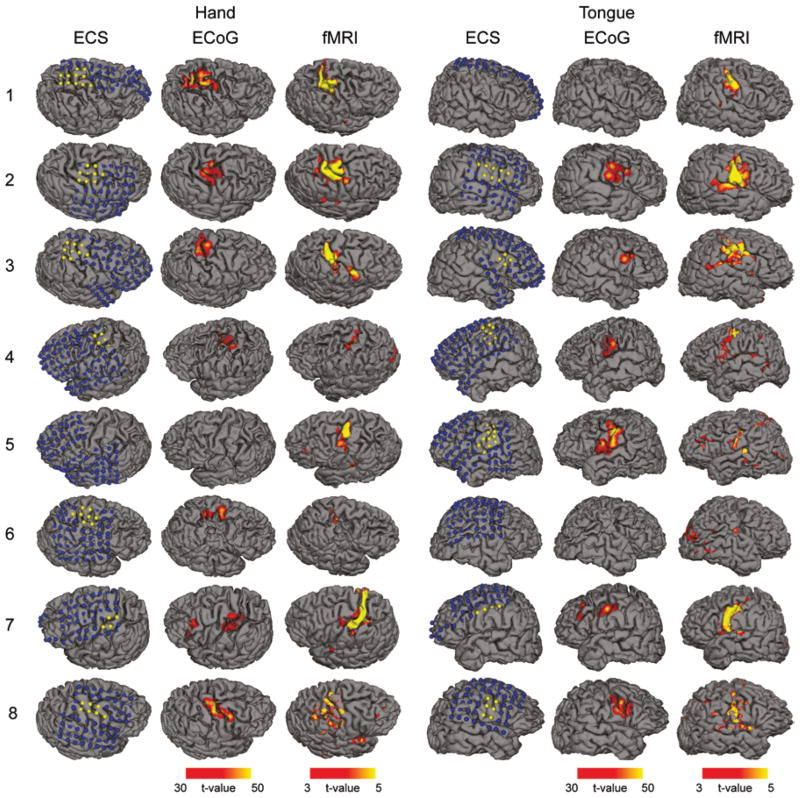
Methods: Seventeen patients with epilepsy participated in an ECoG motor mapping experiment. The patients executed a 5-minute hand/tongue movement task while the ECoG signal was recorded. All 17 patients also underwent extraoperative ECS mapping to localize the motor cortex. Eight patients also participated in a presurgical fMRI study. The high gamma activity on ECoG was modeled using the general linear model (GLM), and the regions showing significant gamma power increase during the task condition compared with the rest condition were localized. The maps derived from GLM-based ECoG mapping, ECS, and fMRI were then compared.
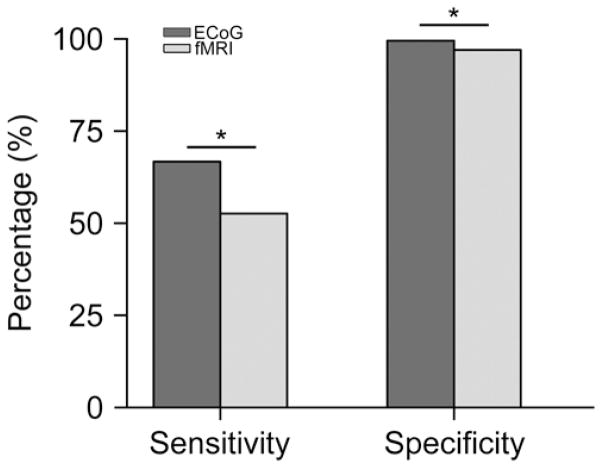
Results: High gamma activity in the motor cortex can be reliably modulated by motor tasks. Localization of the motor regions achieved with GLM-based ECoG mapping was consistent with the localization determined by ECS. The maps also appeared to be highly localized compared with the fMRI activations. Using the ECS findings as the reference, GLM-based ECoG mapping showed a significantly higher sensitivity than fMRI (66.7% for ECoG, 52.6% for fMRI, p<0.05), while the specificity was high for both techniques (>97%). If the current-spreading effect in ECS is accounted for, ECoG mapping may produce maps almost identical to those produced by ECS mapping (100% sensitivity and 99.5% specificity).
Conclusions: General linear model-based ECoG mapping showed a superior performance compared to traditional ECS and fMRI mapping in terms of efficiency and accuracy. Using this method, motor functions can be reliably mapped in less than 5 minutes.
Figures
Comment in
-
Functional mapping.J Neurosurg. 2013 Jul;119(1):24. doi: 10.3171/2012.11.JNS121318. Epub 2013 Apr 19. J Neurosurg. 2013. PMID: 23600940 No abstract available.
-
Response.J Neurosurg. 2013 Jul;119(1):24-5. J Neurosurg. 2013. PMID: 23977689 No abstract available.
Similar articles
-
Recording human electrocorticographic (ECoG) signals for neuroscientific research and real-time functional cortical mapping.J Vis Exp. 2012 Jun 26;(64):3993. doi: 10.3791/3993. J Vis Exp. 2012. PMID: 22782131 Free PMC article.
-
Presurgical language localization with visual naming associated ECoG high- gamma modulation in pediatric drug-resistant epilepsy.Epilepsia. 2017 Apr;58(4):663-673. doi: 10.1111/epi.13708. Epub 2017 Feb 22. Epilepsia. 2017. PMID: 28225156 Free PMC article.
-
Electrocorticographic high gamma activity versus electrical cortical stimulation mapping of naming.Brain. 2005 Jul;128(Pt 7):1556-70. doi: 10.1093/brain/awh491. Epub 2005 Apr 7. Brain. 2005. PMID: 15817517
-
How to establish causality in epilepsy surgery.Brain Dev. 2013 Sep;35(8):706-20. doi: 10.1016/j.braindev.2013.04.004. Epub 2013 May 15. Brain Dev. 2013. PMID: 23684007 Free PMC article. Review.
-
Presurgical language mapping using event-related high-gamma activity: The Detroit procedure.Clin Neurophysiol. 2018 Jan;129(1):145-154. doi: 10.1016/j.clinph.2017.10.018. Epub 2017 Oct 31. Clin Neurophysiol. 2018. PMID: 29190521 Free PMC article. Review.
Cited by
-
Parcellating cortical functional networks in individuals.Nat Neurosci. 2015 Dec;18(12):1853-60. doi: 10.1038/nn.4164. Epub 2015 Nov 9. Nat Neurosci. 2015. PMID: 26551545 Free PMC article.
-
Deep Learning Provides Exceptional Accuracy to ECoG-Based Functional Language Mapping for Epilepsy Surgery.Front Neurosci. 2020 May 6;14:409. doi: 10.3389/fnins.2020.00409. eCollection 2020. Front Neurosci. 2020. PMID: 32435182 Free PMC article.
-
Real-time functional mapping: potential tool for improving language outcome in pediatric epilepsy surgery.J Neurosurg Pediatr. 2014 Sep;14(3):287-95. doi: 10.3171/2014.6.PEDS13477. Epub 2014 Jul 4. J Neurosurg Pediatr. 2014. PMID: 24995815 Free PMC article.
-
Frequency-specific electrophysiologic correlates of resting state fMRI networks.Neuroimage. 2017 Apr 1;149:446-457. doi: 10.1016/j.neuroimage.2017.01.054. Epub 2017 Jan 31. Neuroimage. 2017. PMID: 28159686 Free PMC article.
-
Cortical subnetwork dynamics during human language tasks.Neuroimage. 2016 Jul 15;135:261-72. doi: 10.1016/j.neuroimage.2016.03.072. Epub 2016 Apr 2. Neuroimage. 2016. PMID: 27046113 Free PMC article.
References
-
- Biswal B, Yetkin FZ, Haughton VM, Hyde JS. Functional connectivity in the motor cortex of resting human brain using echo-planar MRI. Magn Reson Med. 1995;34:537–541. - PubMed
-
- Bittar RG, Olivier A, Sadikot AF, Andermann F, Pike GB, Reutens DC. Presurgical motor and somatosensory cortex mapping with functional magnetic resonance imaging and positron emission tomography. J Neurosurg. 1999;91:915–921. - PubMed
-
- Blume WT, Jones DC, Pathak P. Properties of after-discharges from cortical electrical stimulation in focal epilepsies. Clin Neurophysiol. 2004;115:982–989. - PubMed
-
- Brainard DH. The psychophysics toolbox. Spat Vis. 1997;10:433–436. - PubMed
Publication types
MeSH terms
Grants and funding
LinkOut - more resources
Full Text Sources
Other Literature Sources
Medical