. 2013 Oct 24;117(42):12807-19.
doi: 10.1021/jp4020146. Epub 2013 May 30.

Quantifying the mechanism of phosphate monoester hydrolysis in aqueous solution by evaluating the relevant ab initio QM/MM free-energy surfaces

Affiliations

Quantifying the mechanism of phosphate monoester hydrolysis in aqueous solution by evaluating the relevant ab initio QM/MM free-energy surfaces

Nikolay V Plotnikov et al. J Phys Chem B. .

Abstract

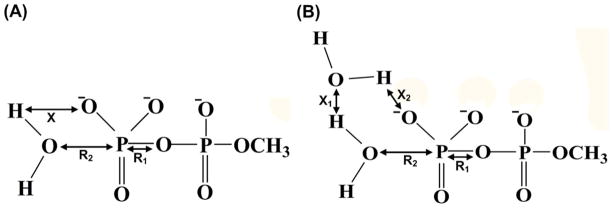
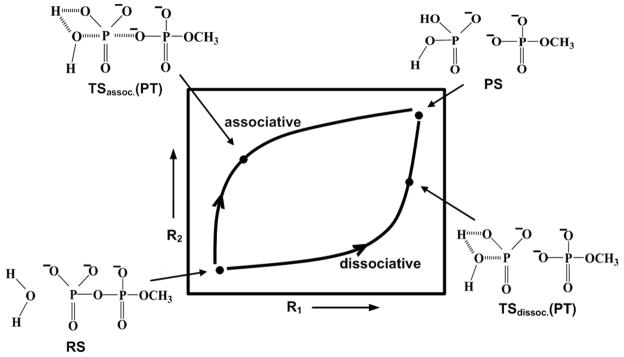
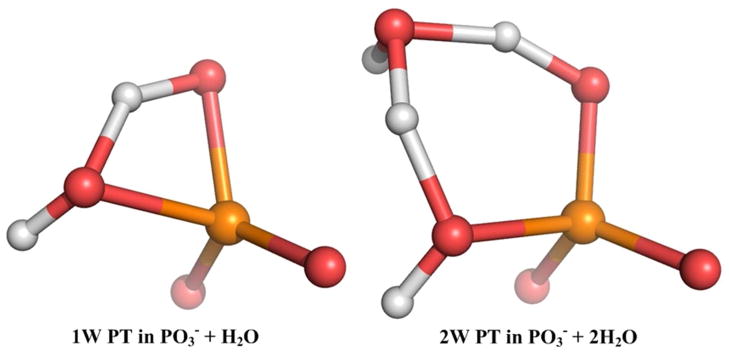
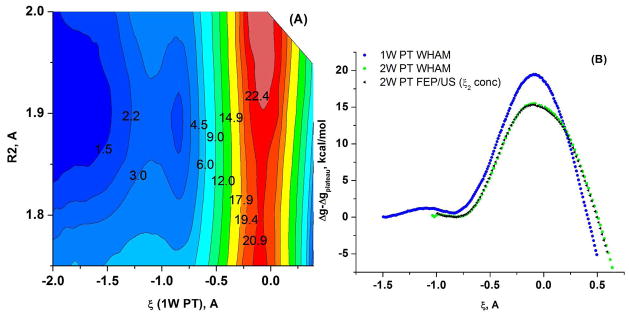
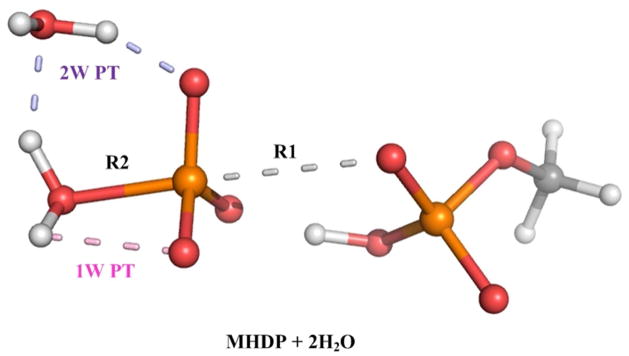
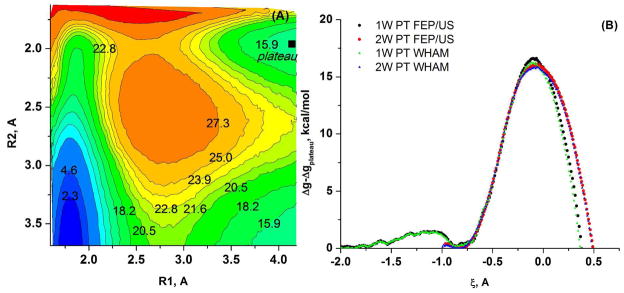
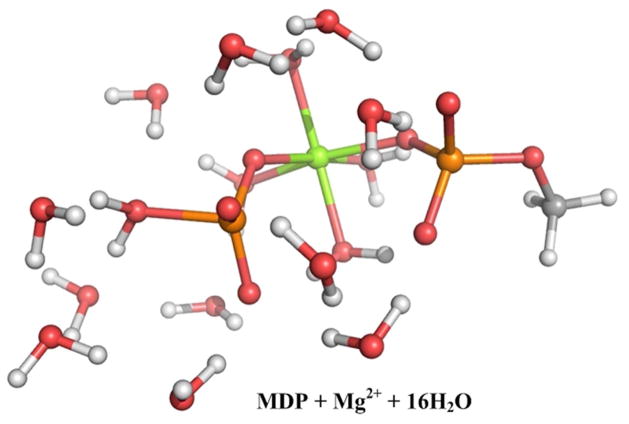
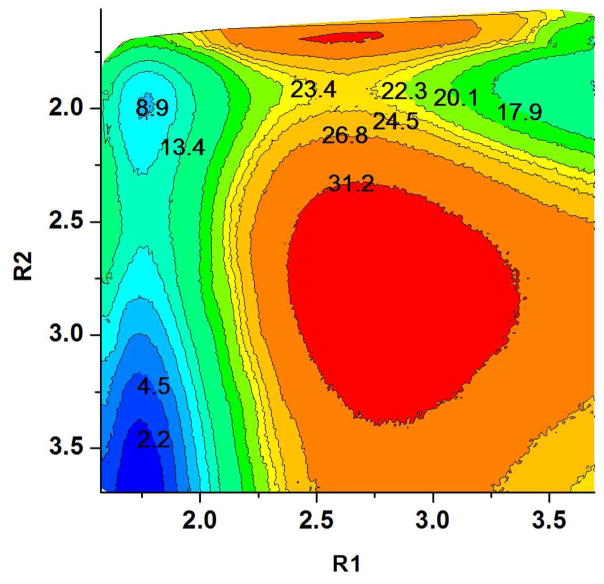
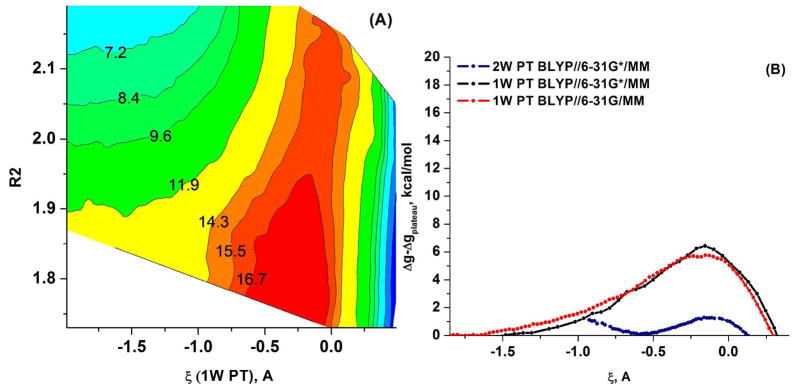
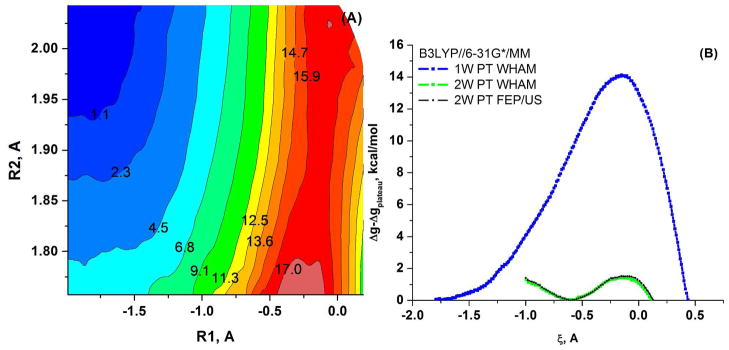
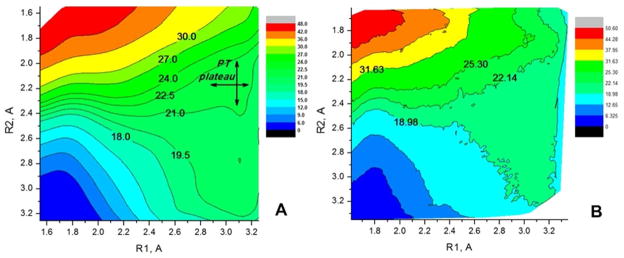
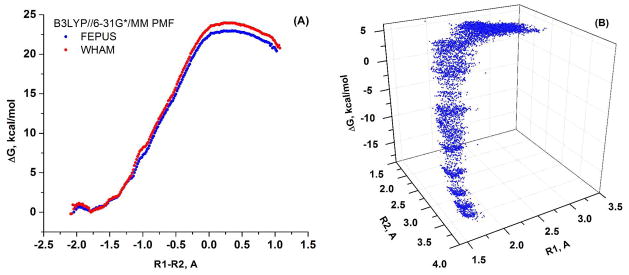
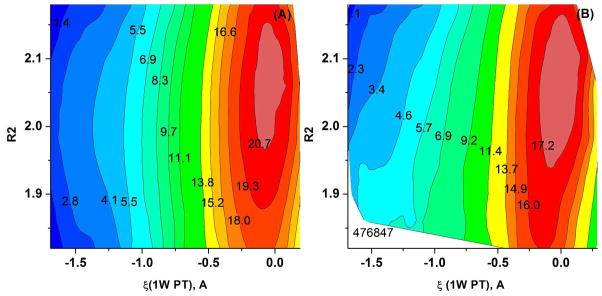
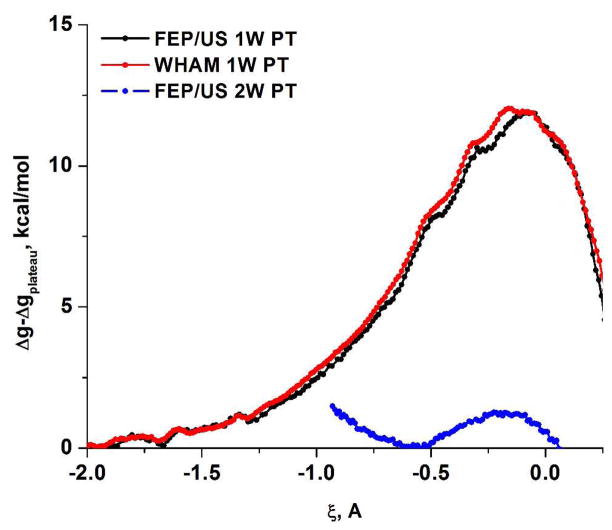
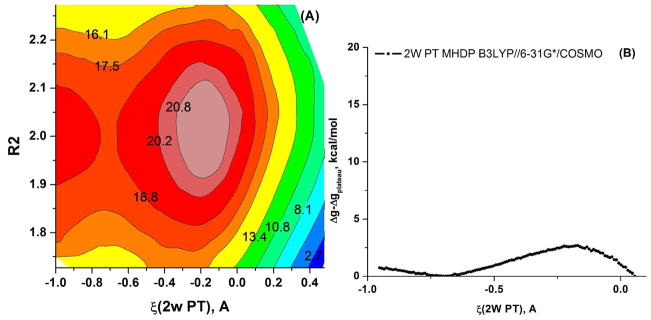
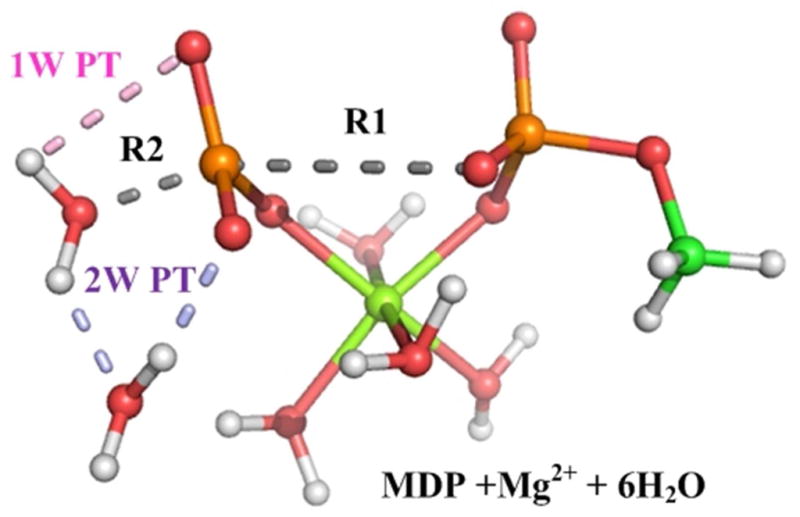
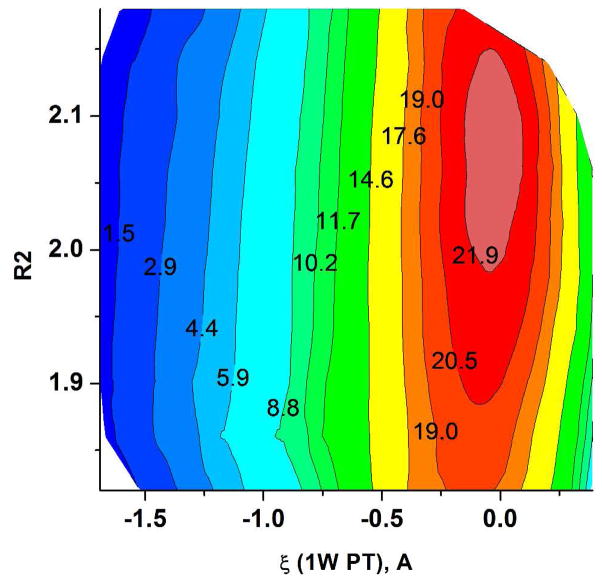
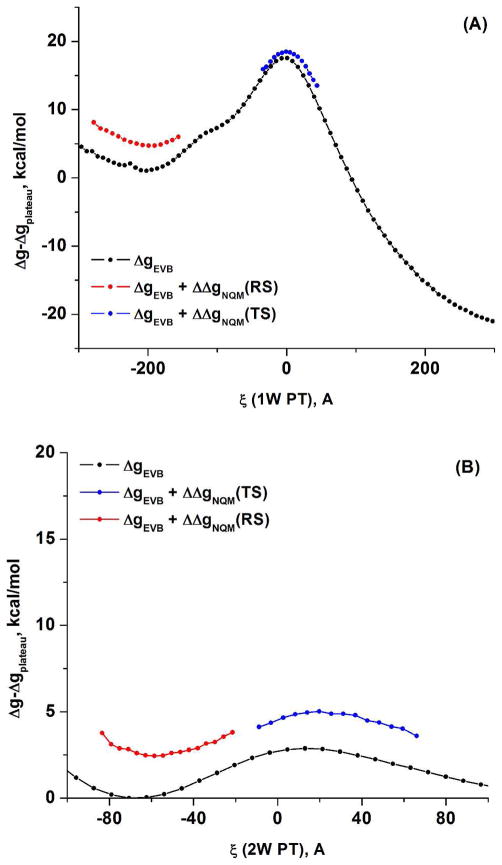
Understanding the nature of the free-energy surfaces for phosphate hydrolysis is a prerequisite for understanding the corresponding key chemical reactions in biology. Here, the challenge has been to move to careful ab initio QM/MM (QM(ai)/MM) free-energy calculations, where obtaining converging results is very demanding and computationally expensive. This work describes such calculations, focusing on the free-energy surface for the hydrolysis of phosphate monoesters, paying special attention to the comparison between the one water (1W) and two water (2W) paths for the proton-transfer (PT) step. This issue has been explored before by energy minimization with implicit solvent models and by nonsystematic QM/MM energy minimization, as well as by nonsystematic free-energy mapping. However, no study has provided the needed reliable 2D (3D) surfaces that are necessary for reaching concrete conclusions. Here we report a systematic evaluation of the 2D (3D) free-energy maps for several relevant systems, comparing the results of QM(ai)/MM and QM(ai)/implicit solvent surfaces, and provide an advanced description of the relevant energetics. It is found that the 1W path for the hydrolysis of the methyl diphosphate (MDP) trianion is 6-9 kcal/mol higher than that the 2W path. This difference becomes slightly larger in the presence of the Mg(2+) ion because this ion reduces the pKa of the conjugated acid form of the phosphate oxygen that accepts the proton. Interestingly, the BLYP approach (which has been used extensively in some studies) gives a much smaller difference between the 1W and 2W activation barriers. At any rate, it is worth pointing out that the 2W transition state for the PT is not much higher that the common plateau that serves as the starting point of both the 1W and 2W PT paths. Thus, the calculated catalytic effects of proteins based on the 2W PT mechanistic model are not expected to be different from the catalytic effects predicted using the 1W PT mechanistic model, which was calibrated on the observed barrier in solution and in which the TS charge distribution was similar to the that of the plateau (as was done in all of our previous EVB studies).


Figures

Figure 1
Figure 1
Defining the coordinates used in the present study of the hydrolysis of monomethyl pytophosphate trianion and related systems. R1, R2, and X define, respectively, the three reaction coordinates, which explicitly will be varied during the course of the reaction. (A) The case where the proton is transferred directly from the attacking nucleophilic water molecule to the substrate phosphate oxygen atom (direct PT (the1W mechanism)). (B) The case where the proton is transferred occurs through the assistance of an additional water molecule (water assisted PT (the 2W mechanism)).
Figure 2
Figure 2
A schematic description of the potential surface for the hydrolysis of monomethyl pytophosphate trianion. The figure also provides a clear definitions of associative and dissociative mechanistic pathways associated with the corresponding hydrolysis reaction.
Figure 3
Figure 3
The simplest models used to study the proton transfer step of the phosphate monoester hydrolysis (PO3 + H2O (or 2H2O)). (LEFT) the near transition state configuration for the mechanisms involving one water molecule. (RIGHT) and two water molecules.
Figure 4
Figure 4
The PM3/MM free energy surfaces calculated for the 1W and 2W proton transfer mechanisms for the (PO3 + H2O (or 2H2O)) system. (A) The 2D free energy surface in the ζ, R2 space, where ζ is the 1W PT coordinate, defined as the difference between the proton-donor and proton-acceptor distances. (B) A comparison of the 1D free energy surfaces along the ζ RC for the 1W PT, obtained using WHAM (black dots) and FEP/US (red dots) and for the 2W PT, obtained with WHAM (black triangles) and with FEP/US (green dots). Note that here the proton acceptor is the second water for 2W PT and the oxygen of the hydrated metaphosphate for the 1W PT.
Figure 5
Figure 5
A description of the QM region used to study the hydrolysis of MHDP. Here the P-O bond (grey dashes) is broken and the two studied mechanisms for the final proton transfer step are shown as pink dashes (1W PT) and as blue dashes (2W PT).
Figure 6
Figure 6
The PM3/MM free energy surface calculated for MHDP + 2 QM water molecules (the model of the QM region given in Figure 5) (A) in the R1, R2 space for the cleavage of the P-O bond (B) for the 1W and the 2W PT mechanisms.
Figure 7
Figure 7
A description of a larger model for the QM region (MDP with Mg2+ and 16 QM water molecule) used to study the hydrolysis reaction. Here the P-O bond is already broken and the system is at the basin prior to the final proton transfer.
Figure 8
Figure 8
The PM3/MM free energy surface for the QM model of Figure 7, calculated in the R1, R2 space for the cleavage of the P-O bond.
Figure 9
Figure 9
(A) The BLYP/MM free energy surfaces calculated for the 1W and 2W proton transfer mechanisms for the (PO3 + H2O (or 2H2O)) system. (A) The 2D free energy surface in ζ, R2 space, where ζ is the 1W PT coordinate defined as the difference between the proton-donor and proton-acceptor distances. (B) A comparison of the 1D free energy surfaces obtained using FEP/US along the ζ RC for the 1W PT path with the 6-31G* basis set (black dots) and the 6-31G basis set (red dots) and for the 2W PT path, obtained with 6-31G* basis set (blue dots). Note that here the proton acceptor is the second water for 2W PT and the oxygen of metaphosphate for 1W PT.
Figure 10
Figure 10
(A) The B3LYP//6-31G*/MM free energy surfaces calculated for the 1W and 2W proton transfer mechanisms for the (PO3 + H2O (or 2H2O)) system. (A) The 2D free energy surface in the ζ, R2 space, where ζ is the 1W PT coordinate defined as the difference between the proton-donor and proton-acceptor distances. (B) A comparison of the 1D free energy surfaces obtained along the ζ RC for the 1W PT path, obtained by WHAM (blue dots) and for the 2W PT path, obtained by WHAM (green dots) and using FEP/US (black dots). Note that here the proton acceptor is the second water for 2W PT and the oxygen of metaphosphate for 1W PT.
Figure 11
Figure 11
The free energy surfaces in the R1, R2 space for MHDP plus 2 QM H2O (the system with the QM region given in Figure 5), for the first step of the ester hydrolysis (the cleavage of the P-O bond) obtained by (A) the PMF/COSMO model ; (B) the B3LYP//6-31G*/MM model.
Figure 12
Figure 12
The B3LYP//6-31G*/MM free energy surface for MDP plus Mg2+ plus 16 QM H2O shown in Figure 7, obtained with a 1D mapping potential, which contained an harmonic constraints on R1-R2 RC: (A) The 1D free energy surface calculated along the R1-R2 RC with FEP/US(blue) and with WHAM(red) and (B) The free energy surface calculated in the R1, R2 space by the FEP/US approach.
Figure 13
Figure 13
The Free energy surfaces for the 1W PT path calculated for the MHDP + 2 QM H2O QM region of Figure 5 using (A) the PMF/B3LYP//6-31G*/COSMO and (B) B3LYP//6-31G*/MM potentials.
Figure 14
Figure 14
Free energy profiles calculated on B3LYP//6-31G*//MM potential for: the 1W PT mechanism using MHDP plus 1 QM water as a model for the QM region (RED was obtained using WHAM; BLACK curve using FEP/US) and for the 2W PT mechanism using MHDP plus 2 QM water (BLUE curve calculated using WHAM).
Figure 15
Figure 15
The Free energy surface for the 2W PT path calculated for the MHDP + 2 QM H2O the QM region of Figure 5 using (A) 2D mapping with the PMF/B3LYP//6-31G*/COSMO model. (B) 1D mapping with the PMF/B3LYP//6-31G*/COSMO model.
Figure 16
Figure 16
A snapshot of one the studied models for the QM region (MDP with Mg2+ and 6 QM water molecules) used to study the PT step in hydrolysis of phosphate monoester. Here the P-O bond is already broken and the system is prior to the final proton transfer.
Figure 17
Figure 17
The Free energy surfaces for the 1W PT path calculated for the model of the QM region given in Figure 16, using the B3LYP//6-31G*/MM potentials.
Figure 18
Figure 18
The nuclear quantum mechanical correction evaluated using the QCP approach of eq. (8) with the calibrated EVB potential for (A) the 1W PT and (B) the 2W PT for the QM region model shown in Figure 5.

Similar articles

Cited by

References

    1. Vetter IR, Wittinghofer A. Nucleoside Triphosphate-Binding Proteins: Different Scaffolds to Achieve Phosphoryl Transfer. Quarterly Reviews of Biophysics. 1999;32:1–56. - PubMed
    1. Cleland WW, Hengge AC. Enzymatic Mechanisms of Phosphate and Sulfate Transfer. Chem Rev. 2006;106:3252–3278. - PubMed
    1. Benkovic SJ, Schray KJ. Academic Press; New York: 1973. pp. 201–238.
    1. Cox JR, Jr, Ramsay OB. Mechanisms of Nucleophilic Substitution in Phosphate Esters. Chem Rev. 1964;64:317–352.
    1. Kirby JA, Warren SG. The Organic Chemistry of Phosphorus. Elsevier; Amsterdam: 1967.

Publication types

LinkOut - more resources