

A systematic review and meta-analysis to revise the Fenton growth chart for preterm infants
- PMID: 23601190
- PMCID: PMC3637477
- DOI: 10.1186/1471-2431-13-59
A systematic review and meta-analysis to revise the Fenton growth chart for preterm infants
Abstract
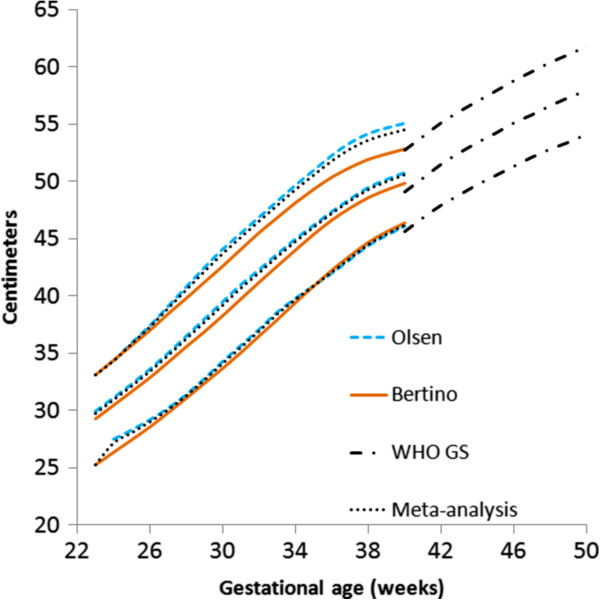
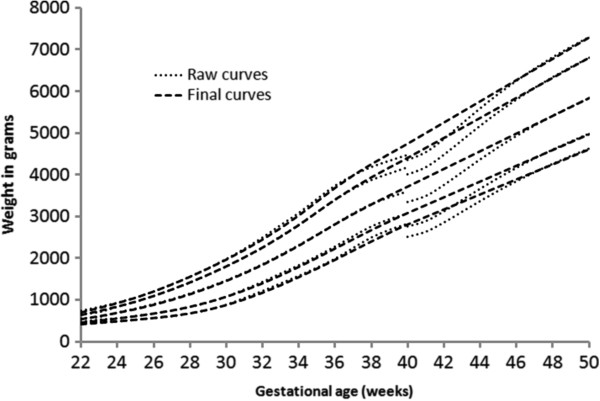
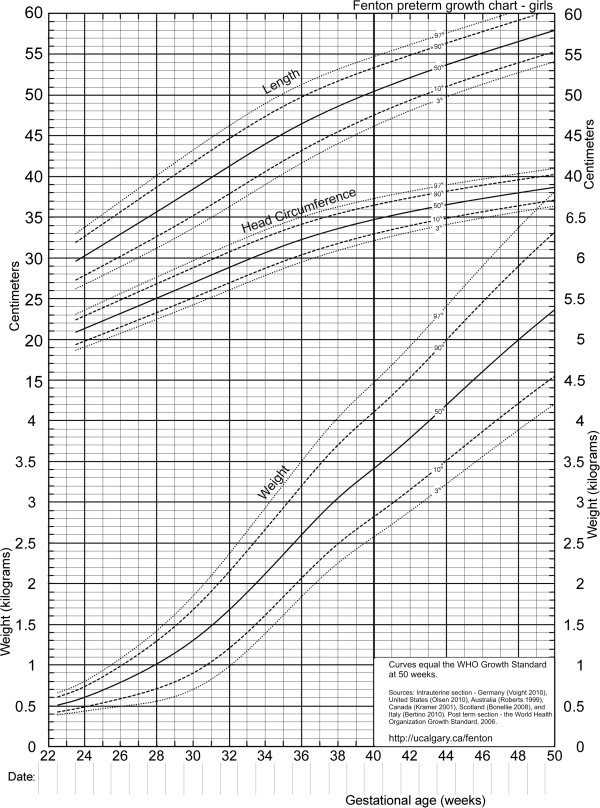
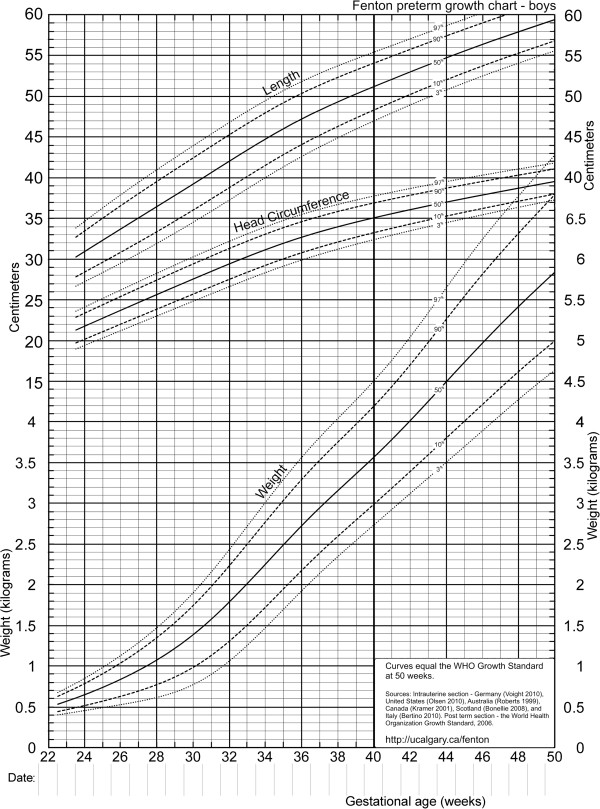
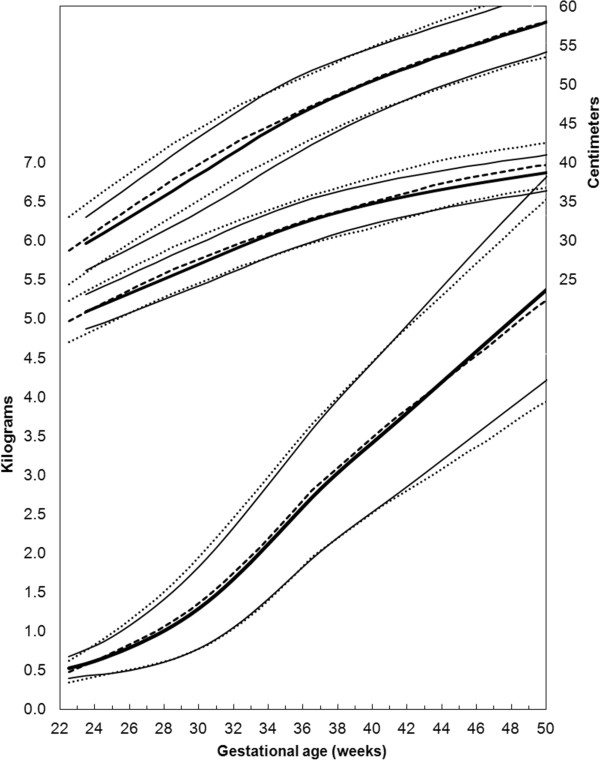
Background: The aim of this study was to revise the 2003 Fenton Preterm Growth Chart, specifically to: a) harmonize the preterm growth chart with the new World Health Organization (WHO) Growth Standard, b) smooth the data between the preterm and WHO estimates, informed by the Preterm Multicentre Growth (PreM Growth) study while maintaining data integrity from 22 to 36 and at 50 weeks, and to c) re-scale the chart x-axis to actual age (rather than completed weeks) to support growth monitoring.
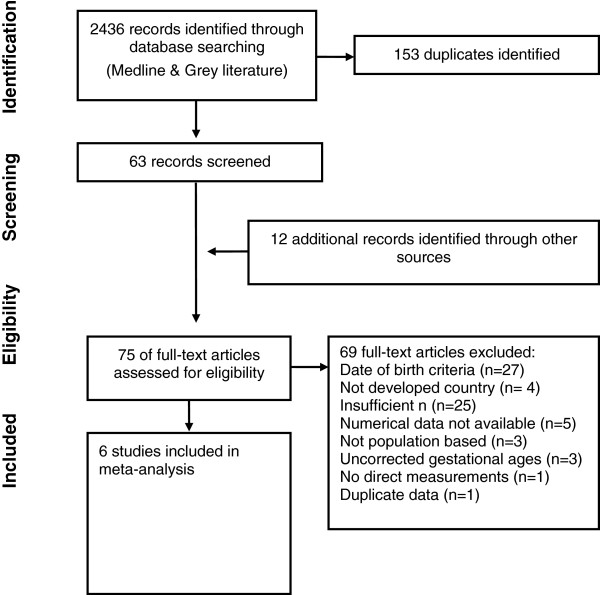
Methods: Systematic review, meta-analysis, and growth chart development. We systematically searched published and unpublished literature to find population-based preterm size at birth measurement (weight, length, and/or head circumference) references, from developed countries with: Corrected gestational ages through infant assessment and/or statistical correction; Data percentiles as low as 24 weeks gestational age or lower; Sample with greater than 500 infants less than 30 weeks. Growth curves for males and females were produced using cubic splines to 50 weeks post menstrual age. LMS parameters (skew, median, and standard deviation) were calculated.
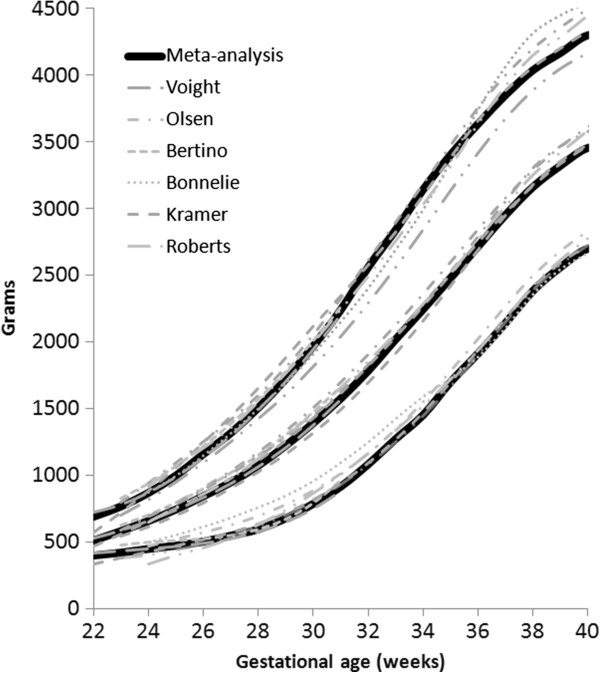
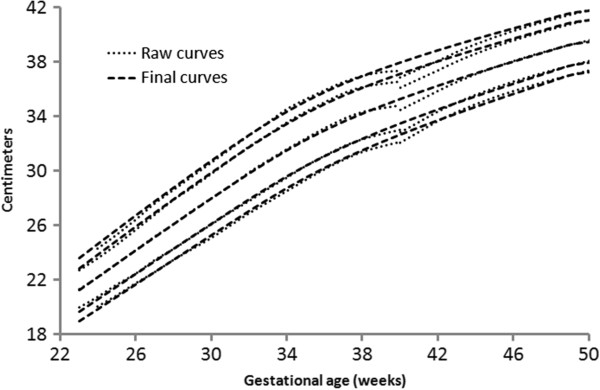
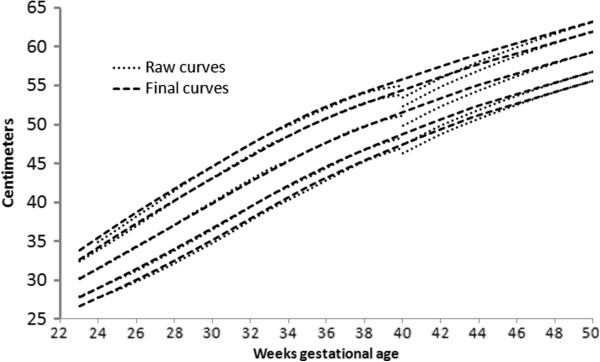
Results: Six large population-based surveys of size at preterm birth representing 3,986,456 births (34,639 births < 30 weeks) from countries Germany, United States, Italy, Australia, Scotland, and Canada were combined in meta-analyses. Smooth growth chart curves were developed, while ensuring close agreement with the data between 24 and 36 weeks and at 50 weeks.
Conclusions: The revised sex-specific actual-age growth charts are based on the recommended growth goal for preterm infants, the fetus, followed by the term infant. These preterm growth charts, with the disjunction between these datasets smoothing informed by the international PreM Growth study, may support an improved transition of preterm infant growth monitoring to the WHO growth charts.
Figures


Comment in
-
Is intrauterine growth appropriate to monitor postnatal growth of preterm neonates?BMC Pediatr. 2014 Jan 17;14:14. doi: 10.1186/1471-2431-14-14. BMC Pediatr. 2014. PMID: 24438124 Free PMC article.
-
Response. Intrauterine growth references are appropriate to monitor postnatal growth of preterm neonates.BMC Pediatr. 2014 Jan 17;14:14. BMC Pediatr. 2014. PMID: 24563909
References
-
- Secker D. Promoting optimal monitoring of child growth in Canada: using the new WHO growth charts. Can J Diet Pract Res. 2010;71:e1–e3. - PubMed
-
- De Onis M, Garza C, Victora CG, Onyango AW, Frongillo EA, Martines J. The WHO Multicentre Growth Reference Study: planning, study design, and methodology. Food Nutr Bull. 2004;25:S15–S26. - PubMed
-
- Borghi E, De Onis M, Garza C, den BJ V, Frongillo EA, Grummer-Strawn L, Van Buuren S, Pan H, Molinari L, Martorell R, Onyango AW, Martines JC. Construction of the World Health Organization child growth standards: selection of methods for attained growth curves. Stat Med. 2006;25:247–265. doi: 10.1002/sim.2227. - DOI - PubMed
-
- Dietitians of Canada, Canadian Pediatric Society, College of Family Physicians of Canada, Community Health Nurses of Canada. Promoting Optimal Monitoring of Child Growth in Canada: Using the New WHO Growth Charts. Can J Diet Pract Res. 2010;71:1–22. - PubMed
-
- Committee on Nutrition American Academy Pediatrics. Nutritional Needs of Preterm Infants. 6. Elk Grove Village Il: American Academy Pediatrics; 2009. (Pediatric Nutrition Handbook).
Publication types
MeSH terms
LinkOut - more resources
Full Text Sources
Other Literature Sources
Medical
