. 2013 Apr 21:14:133.
doi: 10.1186/1471-2105-14-133.

How cyanobacteria pose new problems to old methods: challenges in microarray time series analysis

Affiliations

How cyanobacteria pose new problems to old methods: challenges in microarray time series analysis

Robert Lehmann et al. BMC Bioinformatics. .

Abstract

Background: The transcriptomes of several cyanobacterial strains have been shown to exhibit diurnal oscillation patterns, reflecting the diurnal phototrophic lifestyle of the organisms. The analysis of such genome-wide transcriptional oscillations is often facilitated by the use of clustering algorithms in conjunction with a number of pre-processing steps. Biological interpretation is usually focussed on the time and phase of expression of the resulting groups of genes. However, the use of microarray technology in such studies requires the normalization of pre-processing data, with unclear impact on the qualitative and quantitative features of the derived information on the number of oscillating transcripts and their respective phases.

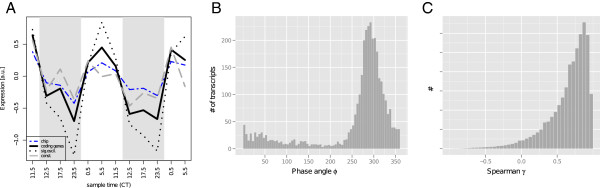
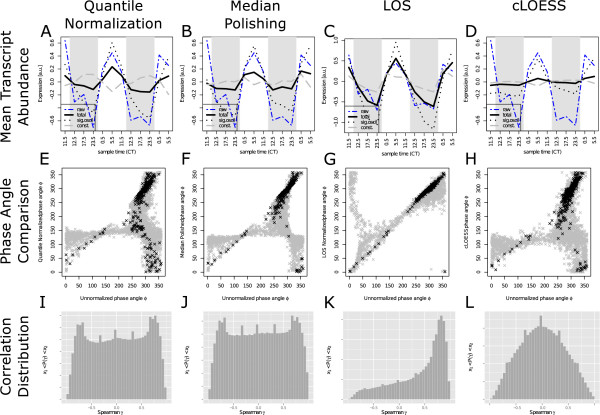
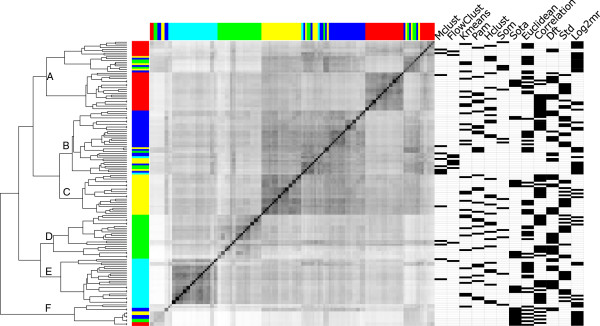
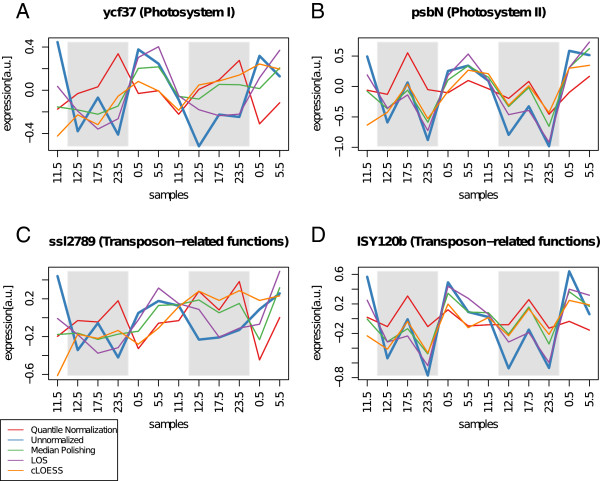
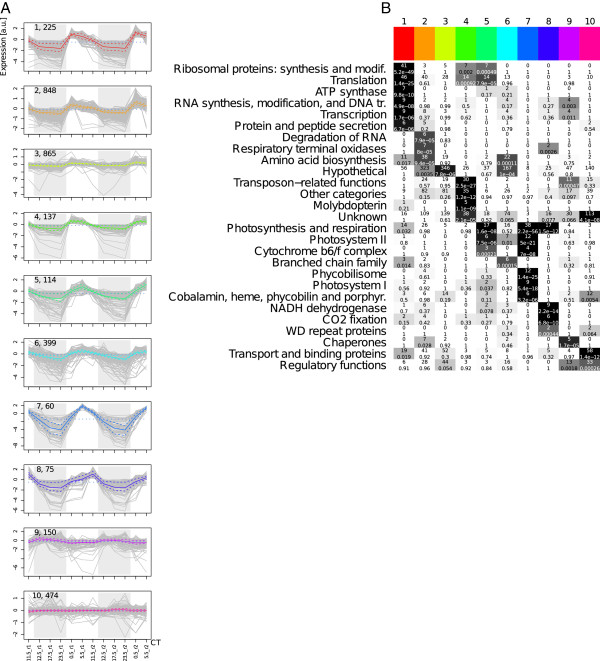
Results: A microarray based evaluation of diurnal expression in the cyanobacterium Synechocystis sp. PCC 6803 is presented. As expected, the temporal expression patterns reveal strong oscillations in transcript abundance. We compare the Fourier transformation-based expression phase before and after the application of quantile normalization, median polishing, cyclical LOESS, and least oscillating set (LOS) normalization. Whereas LOS normalization mostly preserves the phases of the raw data, the remaining methods introduce systematic biases. In particular, quantile-normalization is found to introduce a phase-shift of 180°, effectively changing night-expressed genes into day-expressed ones. Comparison of a large number of clustering results of differently normalized data shows that the normalization method determines the result. Subsequent steps, such as the choice of data transformation, similarity measure, and clustering algorithm, only play minor roles. We find that the standardization and the DTF transformation are favorable for the clustering of time series in contrast to the 12 m transformation. We use the cluster-wise functional enrichment of a clustering derived by LOS normalization, clustering using flowClust, and DFT transformation to derive the diurnal biological program of Synechocystis sp..

Conclusion: Application of quantile normalization, median polishing, and also cyclic LOESS normalization of the presented cyanobacterial dataset lead to increased numbers of oscillating genes and the systematic shift of the expression phase. The LOS normalization minimizes the observed detrimental effects. As previous analyses employed a variety of different normalization methods, a direct comparison of results must be treated with caution.


Figures

Figure 1
Figure 1
Oscillation of the unprocessed total signal. A) Prior to any pre-processing, the mean transcript abundance for all genes on the chip (blue dashed) and all 3347 protein-coding genes (black solid) exhibits diurnal oscillations. Significantly oscillating genes (posc < 0.05) resemble the oscillation of the total intensity (black dotted), whereas the non-significantly oscillating genes (posc > 0.05) exhibit show increased expression over the day and a peak at 17.5 CT (gray dashed). B) The majority of genes exhibit a phase angle ϕ in the range of 250−350 corresponding to expression over the day. C) The histogram of Spearman correlation coefficients γ between all pairwise combinations of the 3447 protein coding genes shows that most genes strongly correlate. Only a small amount of pairs is uncorrelated or anti-correlated.
Figure 2
Figure 2
Normalization changes phase angles and expression correlation. Systematic comparison of important properties of the expression profile set after normalization with different methods. Columns one to four correspond to the methods quantile normalization, median polishing, LOS, and cLOESS, respectively. Rows one to three correspond to plots of prominent average expression profiles, expression phase comparisons, and pairwise correlation distributions. The mean expression profiles for different gene groups illustrate the impact of normalization methods. A comparison of the unnormalized mean expression profile of all genes (dashed blue) with the normalized mean over all genes (black solid), significantly oscillating genes (posc < 0.05 in unnormalized data - black dotted) and not oscillating genes (posc > 0.05 in unnormalized data - gray dashed) is shown in panel A to D. The time of maximal expression in oscillatory profiles, measured using the Fourier transformation, is frequently altered by the normalization method. Panel E to H show the comparison between expression phases observed in the unnormalized (x-axis) versus normalized (y-axis) data. Profiles with significantly oscillating expression (posc < 0.05) are shown in black, whereas weak or non-oscillators are shown in gray (posc > 0.05). The histogram of pairwise Spearman correlation coefficients between expression profiles as proxy of the diversity of the global expression landscape is shown in panels I to L.
Figure 3
Figure 3
Clustering results are determined by the normalization. Pairwise similarity between all clusterings with eight clusters, similarity is measured using mutual information. White encodes minimal similarity over gray to black for maximal similarity. Rows and columns of the symmetrical matrix are ordered identically according to hierarchical clustering (Hclust, complete link method) of the similarities, represented as dendrogram on the left. The normalization method applied to the data before clustering is color-coded: no normalization - blue, median polishing - yellow, LOS - green, cLOESS - cyan, quantile normalization - red. The remaining processing steps (clustering algorithm, similarity measure, transformation) are represented as black bars in the corresponding column on the right. The column “correlation” marks the usage of the Spearman correlation coefficient as similarity measure except for clusterings obtained from SOTA, which only allows usage of the Pearson correlation.
Figure 4
Figure 4
Phase changes in high amplitude diurnal expression profiles due to normalization. The expression profiles of four genes with clear diurnal oscillations before and after normalization with several methods using 12 m transformed data. The expression profiles are shown in different colors as provided in the legend. The gray shaded area marks the subjective night. The genes ycf37 (A) and psbN (B) are functionally associated with the photosynthesis and exhibit induced expression over the day. The expression phase ϕ after quantile normalization is shifted by ≈130°. The genes ssl2789 (C) and ISY120b (D) have transposon-related functions and are phase shifted by ≈160° after quantile normalization.
Figure 5
Figure 5
Clustering after LOS normalization yields coarse biological program. The clustering of LOS normalized DFT transformed data using the flowClust approach with ten clusters is shown in panel A. The gray lines represent individual gene profiles, the solid colored line marks the cluster mean profile, and the dashed colored lines mark the 5% and 95% quantiles. For visualization the 12 m transformed data are used. On the upper left corner of every profile plot, the cluster index is given followed by the number of genes in the corresponding cluster. The gray shaded area marks the dark period. The clusters are sorted by the mean phase angle ϕ. A graphical representation of the cluster-wise functional enrichment of the clustering shown in A is presented. The rows of this matrix correspond to biological functions whereas the columns correspond to clusters, where the color marks on the top match the colors used for the cluster mean profiles. The number of genes with the corresponding function is shown on the top of each cell and the enrichment p-value on the bottom. Furthermore, the enrichment p-value is color-coded in the cell background, marking highly significant enrichments in black and non-significant enrichments in white. The rows were rearranged to reveal the temporal ordering.

References

    1. Woelfle MA, Johnson CH. No promoter left behind: global circadian gene expression in cyanobacteria. J Biol Rhythms. 2006;21(6):419–431. doi: 10.1177/0748730406294418. - DOI - PMC - PubMed
    1. Aurora R, Hihara Y, Singh AK, Pakrasi HB. A network of genes regulated by light in cyanobacteria. Omics : A J Integr Biol. 2007;11(2):166–185. doi: 10.1089/omi.2007.4323. - DOI - PubMed
    1. Stöckel J, Welsh Ea, Liberton M, Kunnvakkam R, Aurora R, Pakrasi HB. Global transcriptomic analysis of Cyanothece 51142 reveals robust diurnal oscillation of central metabolic processes. Proc Natl Acad Sci U S A. 2008;105(16):6156–6161. doi: 10.1073/pnas.0711068105. - DOI - PMC - PubMed
    1. Kucho Ki, Okamoto K, Tsuchiya Y. Global analysis of circadian expression in the cyanobacterium Synechocystis sp. strain PCC 6803. J Bacteriol. 2005;187(6):2190. doi: 10.1128/JB.187.6.2190-2199.2005. - DOI - PMC - PubMed
    1. Toepel J, Welsh E, Summerfield TC, Pakrasi HB, Sherman LA. Differential transcriptional analysis of the cyanobacterium Cyanothece sp. strain ATCC 51142 during light-dark and continuous-light growth. J Bacteriol. 2008;190(11):3904–3913. doi: 10.1128/JB.00206-08. - DOI - PMC - PubMed

Publication types

MeSH terms